
Page 614 - Provincial Treasury Estimates.pdf
P. 614
Department: +XPDQ 6HWWOHPHQWV
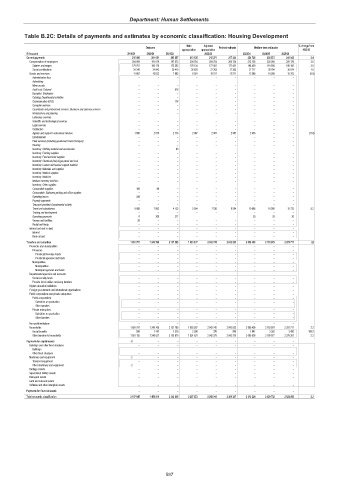
Table B.2C: Details of payments and estimates by economic classification: Housing Development
Main Adjusted % change from
Outcome Revised estimate Medium-term estimates
appropriation appropriation 2022/23
R thousand 2019/20 2020/21 2021/22 2022/23 2023/24 2024/25 2025/26
Current payments 215 896 201 051 205 657 213 335 215 271 217 324 224 725 236 873 240 942 3.4
Compensation of employees 204 009 191 019 197 672 204 754 204 754 204 754 212 156 220 284 225 179 3.6
Salaries and wages 179 761 166 176 172 262 178 134 177 451 177 451 184 439 191 500 195 105 3.9
Social contributions 24 248 24 843 25 410 26 620 27 303 27 303 27 717 28 784 30 074 1.5
Goods and services 11 887 10 032 7 985 8 581 10 517 12 571 12 569 16 589 15 763 (0.0)
Administrative fees – – – – – – – – –
Advertising – – – – – – – – –
Minor assets – – – – – – – – –
Audit cost: External – – 618 – – – – – –
Bursaries: Employees – – – – – – – – –
Catering: Departmental activities – – – – – – – – –
Communication (G&S) – – 178 – – – – – –
Computer services – – – – – – – – –
Consultants and professional services: Business and advisory services – – – – – – – – –
Infrastructure and planning – – – – – – – – –
Laboratory services – – – – – – – – –
Scientific and technological services – – – – – – – – –
Legal services – – – – – – – – –
Contractors – – – – – – – – –
Agency and support / outsourced services 1 890 2 575 2 716 2 987 2 987 2 987 2 455 – – (17.8)
Entertainment – – – – – – – – –
Fleet services (including government motor transport) – – – – – – – – –
Housing – – – – – – – – –
Inventory: Clothing material and accessories – – 63 – – – – – –
Inventory: Farming supplies – – – – – – – – –
Inventory: Food and food supplies – – – – – – – – –
Inventory: Chemicals,fuel,oil,gas,wood and coal – – – – – – – – –
Inventory: Learner and teacher support material – – – – – – – – –
Inventory: Materials and supplies – – – – – – – – –
Inventory: Medical supplies – – – – – – – – –
Inventory: Medicine – – – – – – – – –
Medsas inventory interface – – – – – – – – –
Inventory: Other supplies – – – – – – – – –
Consumable supplies 108 69 – – – – – – –
Consumable: Stationery,printing and office supplies – – – – – – – – –
Operating leases 249 – – – – – – – –
Property payments – – – – – – – – –
Transport provided: Departmental activity – – – – – – – – –
Travel and subsistence 9 608 7 082 4 133 5 594 7 530 9 584 10 086 16 560 15 733 5.2
Training and development – – – – – – – – –
Operating payments 6 306 277 – – – 28 29 30
Venues and facilities 26 – – – – – – – –
Rental and hiring – – – – – – – – –
Interest and rent on land – – – – – – – – –
Interest – – – – – – – – –
Rent on land – – – – – – – – –
Transfers and subsidies 1 891 751 1 249 768 2 137 188 1 993 937 2 042 745 2 042 923 2 088 499 2 183 879 2 281 717 2.2
Provinces and municipalities – – – – – – – – –
Provinces – – – – – – – – –
Provincial Revenue Funds – – – – – – – – –
Provincial agencies and funds – – – – – – – – –
Municipalities – – – – – – – – –
Municipalities – – – – – – – – –
Municipal agencies and funds – – – – – – – – –
Departmental agencies and accounts – – – – – – – – –
Social security funds – – – – – – – – –
Provide list of entities receiving transfers – – – – – – – – –
Higher education institutions – – – – – – – – –
Foreign governments and international organisations – – – – – – – – –
Public corporations and private enterprises – – – – – – – – –
Public corporations – – – – – – – – –
Subsidies on production – – – – – – – – –
Other transfers – – – – – – – – –
Private enterprises – – – – – – – – –
Subsidies on production – – – – – – – – –
Other transfers – – – – – – – – –
Non-profit institutions – – – – – – – – –
Households 1 891 751 1 249 768 2 137 188 1 993 937 2 042 745 2 042 923 2 088 499 2 183 879 2 281 717 2.2
Social benefits 596 1 141 1 318 2 306 370 548 1 641 3 302 3 450 199.5
Other transfers to households 1 891 155 1 248 627 2 135 870 1 991 631 2 042 375 2 042 375 2 086 858 2 180 577 2 278 267 2.2
Payments for capital assets -2 – – – – – – – –
Buildings and other fixed structures – – – – – – – – –
Buildings – – – – – – – – –
Other fixed structures – – – – – – – – –
Machinery and equipment -2 – – – – – – – –
Transport equipment – – – – – – – – –
Other machinery and equipment -2 – – – – – – – –
Heritage Assets – – – – – – – – –
Specialised military assets – – – – – – – – –
Biological assets – – – – – – – – –
Land and sub-soil assets – – – – – – – – –
Software and other intangible assets – – – – – – – – –
Payments for financial assets – – – – – – – – –
Total economic classification 2 107 645 1 450 819 2 342 845 2 207 272 2 258 016 2 260 247 2 313 224 2 420 752 2 522 659 2.3
597