Page 611 - Provincial Treasury Estimates.pdf
P. 611

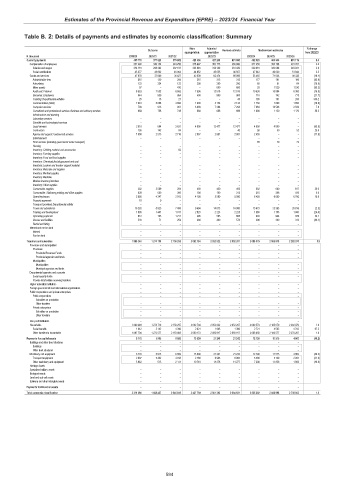
Estimates of the Provincial Revenue and Expenditure (EPRE) – 2023/24  Financial Year

           Table B. 2: Details of payments and estimates by economic classification: Summary

                                                                     Main   Adjusted                          % change
                                                       Outcome                   Revised estimate  Medium-term estimates
                                                                    appropriation  appropriation              from 2022/23
            R thousand                          2019/20  2020/21  2021/22   2022/23      2023/24  2024/25  2025/26
            Current payments                                   405 170                 377 823                 379 882                 421 436                 427 249                 431 093                 432 923                 464 344                 451 119  0.4
             Compensation of employees                         357 492                 340 154                 343 255                 378 897                 363 775                 365 006                 377 458                 392 706                 401 781  3.4
              Salaries and wages                               314 115                 296 292                 297 191                 333 945                 318 140                 318 439                 329 815                 343 086                 349 937  3.6
              Social contributions                               43 377                   43 862                   46 064                   44 952                   45 635                   46 567                   47 643                   49 620                   51 844  2.3
             Goods and services                                  47 678                   37 669                   36 627                   42 539                   63 474                   66 086                   55 465                   71 638                   49 338  (16.1)
              Administrative fees                  315    130    204    215    315    315    177   181    189    (43.8)
              Advertising                          123    224    122    200    200    200    60     61     64    (70.0)
              Minor assets                          97     –     410     –     600    600    28                     1 529                     1 530  (95.3)
              Audit cost: External                                 8 553                     7 532  8 553                     7 506  12 518                   12 518                   10 638                   10 884                     8 300  (15.0)
              Bursaries: Employees                 944    959    864    400    900    900    710   742    775    (21.1)
              Catering: Departmental activities     25    15     27      –      –     43     185   191    200    330.2
              Communication (G&S)                                  7 881                     5 086  4 898                     1 800                     2 134                     2 134                     1 750                     1 800                     1 850  (18.0)
              Computer services                    789    913    901                     6 809                     7 294                     7 294                     7 864                   16 548                     3 500  7.8
              Consultants and professional services: Business and advisory services  958  758  748  560  688  689                     1 090                     1 120                     1 170  58.3
              Infrastructure and planning           –      –      –      –      –      –     –      –      –
              Laboratory services                   –      –      –      –      –      –     –      –      –
              Scientific and technological services  –     –      –      –      –      –     –      –      –
              Legal services                                       2 010  684                     3 631                     4 000                   12 477                   12 477                     4 500                     4 500  –  (63.9)
              Contractors                          105    142    84      –      –     40     50     50     52    25.0
              Agency and support / outsourced services                      1 890                     2 575                     2 716                     2 987                     2 987                     2 987                     2 455  –  –  (17.8)
              Entertainment                         –      –      –      –      –      –     –      –      –
              Fleet services (including government motor transport)  –  –  –  –  –     –     65     70     73
              Housing                               –      –      –      –      –      –     –      –      –
              Inventory: Clothing material and accessories  –  –  63     –      –      –     –      –      –
              Inventory: Farming supplies           –      –      –      –      –      –     –      –      –
              Inventory: Food and food supplies     –      –      –      –      –      –     –      –      –
              Inventory: Chemicals,fuel,oil,gas,wood and coal  –  –  –   –      –      –     –      –      –
              Inventory: Learner and teacher support material  –  –  –   –      –      –     –      –      –
              Inventory: Materials and supplies     –      –      –      –      –      –     –      –      –
              Inventory: Medical supplies           –      –      –      –      –      –     –      –      –
              Inventory: Medicine                   –      –      –      –      –      –     –      –      –
              Medsas inventory interface            –      –      –      –      –      –     –      –      –
              Inventory: Other supplies             –      –      –      –      –      –     –      –      –
              Consumable supplies                  382                     2 589  204  450  450  450  582  600  617  29.3
              Consumable: Stationery,printing and office supplies  639  660  306  100  100  313  315  398  410    0.6
              Operating leases                                     3 695                     4 247                     2 913                     4 100                     5 580                     5 580                     6 450                     6 600                     6 700  15.6
              Property payments                     10     9      –      –      –      –     –      –      –
              Transport provided: Departmental activity  –  –     –      –      –      –     –      –      –
              Travel and subsistence                             16 282                     8 925                     7 495                     9 694                   14 013                   16 080                   15 673                   23 365                   20 816  (2.5)
              Training and development                             1 835                     1 447                     1 017                     2 823                     2 223                     2 223                     1 680                     1 755                     1 800  (24.4)
              Operating payments                   612    703                     1 211  495  595  666  893  944  979  34.1
              Venues and facilities                533    71     259    400    400    578    300   300    313    (48.1)
              Rental and hiring                     –      –      –      –      –      –     –      –      –
             Interest and rent on land              –      –      –      –      –      –     –      –      –
              Interest                              –      –      –      –      –      –     –      –      –
              Rent on land                          –      –      –      –      –      –     –      –      –
            Transfers and subsidies                         1 899 346              1 274 719              2 158 255              2 002 794              2 052 822              2 052 297              2 089 579              2 185 079              2 282 970  1.8
             Provinces and municipalities           –      –      –      –      –      –     –      –      –
              Provinces                             –      –      –      –      –      –     –      –      –
               Provincial Revenue Funds             –      –      –      –      –      –     –      –      –
               Provincial agencies and funds        –      –      –      –      –      –     –      –      –
              Municipalities                        –      –      –      –      –      –     –      –      –
               Municipalities                       –      –      –      –      –      –     –      –      –
               Municipal agencies and funds         –      –      –      –      –      –     –      –      –
             Departmental agencies and accounts     –      –      –      –      –      –     –      –      –
              Social security funds                 –      –      –      –      –      –     –      –      –
              Provide list of entities receiving transfers  –  –  –      –      –      –     –      –      –
             Higher education institutions          –      –      –      –      –      –     –      –      –
             Foreign governments and international organisations  –  –  –  –    –      –     –      –      –
             Public corporations and private enterprises  –  –    –      –      –      –     –      –      –
              Public corporations                   –      –      –      –      –      –     –      –      –
               Subsidies on production              –      –      –      –      –      –     –      –      –
               Other transfers                      –      –      –      –      –      –     –      –      –
              Private enterprises                   –      –      –      –      –      –     –      –      –
               Subsidies on production              –      –      –      –      –      –     –      –      –
               Other transfers                      –      –      –      –      –      –     –      –      –
             Non-profit institutions                –      –      –      –      –      –     –      –      –
             Households                                     1 899 346              1 274 719              2 158 255              2 002 794              2 052 822              2 052 297              2 089 579              2 185 079              2 282 970  1.8
              Social benefits                                      1 642                     2 142                     4 390                     2 621                     1 905                     1 380                     2 721                     4 502                     4 703  97.2
              Other transfers to households                 1 897 704              1 272 577              2 153 865              2 000 173              2 050 917              2 050 917              2 086 858              2 180 577              2 278 267  1.8
            Payments for capital assets                            6 770                     5 915                     6 899                   13 500                   21 241                   21 242                   12 700                   17 575                     4 863  (40.2)
             Buildings and other fixed structures   –      –      –      –      –      –     –      –      –
              Buildings                             –      –      –      –      –      –     –      –      –
              Other fixed structures                –      –      –      –      –      –     –      –      –
             Machinery and equipment                               6 770                     5 915                     6 899                   13 500                   21 241                   21 242                   12 700                   17 575                     4 863  (40.2)
              Transport equipment                                  2 907                     5 402                     4 788                     2 760                     6 965                     6 965                     5 500                     5 739                     2 997  (21.0)
              Other machinery and equipment                        3 863  513                     2 111                   10 740                   14 276                   14 277                     7 200                   11 836                     1 866  (49.6)
             Heritage Assets                        –      –      –      –      –      –     –      –      –
             Specialised military assets            –      –      –      –      –      –     –      –      –
             Biological assets                      –      –      –      –      –      –     –      –      –
             Land and sub-soil assets               –      –      –      –      –      –     –      –      –
             Software and other intangible assets   –      –      –      –      –      –     –      –      –
            Payments for financial assets           –      –      –      –      –      –     –      –      –
            Total economic classification                   2 311 286               1 658 457               2 545 035               2 437 730               2 501 312               2 504 631               2 535 202               2 666 998               2 738 952  1.2


                                                             594
   606   607   608   609   610   611   612   613   614   615   616