
Page 612 - Provincial Treasury Estimates.pdf
P. 612
Department: +XPDQ 6HWWOHPHQWV
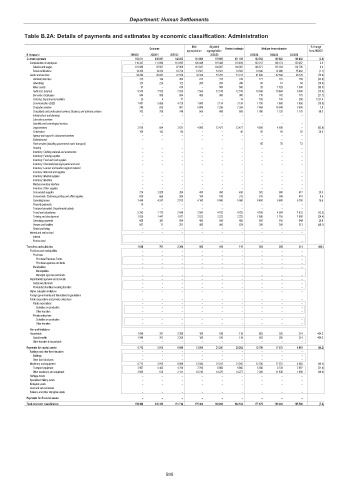
Table B.2A: Details of payments and estimates by economic classification: Administration
Main Adjusted % change
Outcome Revised estimate Medium-term estimates
appropriation appropriation from 2022/23
R thousand 2019/20 2020/21 2021/22 2022/23 2023/24 2024/25 2025/26
Current payments 150 611 138 837 142 605 161 806 170 665 171 183 164 512 180 682 160 492 (3.9)
Compensation of employees 116 347 111 890 114 695 128 448 119 408 119 409 123 017 128 174 130 367 3.0
Salaries and wages 101 888 97 667 97 969 113 947 104 907 104 907 108 671 113 184 114 705 3.6
Social contributions 14 459 14 223 16 726 14 501 14 501 14 502 14 346 14 990 15 662 (1.1)
Goods and services 34 264 26 947 27 910 33 358 51 257 51 774 41 495 52 508 30 125 (19.9)
Administrative fees 315 130 204 215 315 315 177 181 189 (43.8)
Advertising 123 224 122 200 200 200 60 61 64 (70.0)
Minor assets 97 – 410 – 600 600 28 1 529 1 530 (95.3)
Audit cost: External 8 553 7 532 7 935 7 506 12 518 12 518 10 638 10 884 8 300 (15.0)
Bursaries: Employees 944 959 864 400 900 900 710 742 775 (21.1)
Catering: Departmental activities 25 4 17 – – 14 185 191 200 1221.4
Communication (G&S) 7 881 5 086 4 720 1 800 2 134 2 134 1 750 1 800 1 850 (18.0)
Computer services 789 913 901 6 809 7 294 7 294 7 864 16 548 3 500 7.8
Consultants and professional services: Business and advisory services 762 758 748 560 688 689 1 090 1 120 1 170 58.3
Infrastructure and planning – – – – – – – – –
Laboratory services – – – – – – – – –
Scientific and technological services – – – – – – – – –
Legal services 2 010 684 3 631 4 000 12 477 12 477 4 500 4 500 – (63.9)
Contractors 105 142 84 – – 40 50 50 52 25.0
Agency and support / outsourced services – – – – – – – – –
Entertainment – – – – – – – – –
Fleet services (including government motor transport) – – – – – – 65 70 73
Housing – – – – – – – – –
Inventory: Clothing material and accessories – – – – – – – – –
Inventory: Farming supplies – – – – – – – – –
Inventory: Food and food supplies – – – – – – – – –
Inventory: Chemicals,fuel,oil,gas,wood and coal – – – – – – – – –
Inventory: Learner and teacher support material – – – – – – – – –
Inventory: Materials and supplies – – – – – – – – –
Inventory: Medical supplies – – – – – – – – –
Inventory: Medicine – – – – – – – – –
Medsas inventory interface – – – – – – – – –
Inventory: Other supplies – – – – – – – – –
Consumable supplies 274 2 520 204 450 450 450 582 600 617 29.3
Consumable: Stationery,printing and office supplies 639 660 306 100 100 313 315 398 410 0.6
Operating leases 3 446 4 247 2 913 4 100 5 580 5 580 6 450 6 600 6 700 15.6
Property payments 10 – – – – – – – –
Transport provided: Departmental activity – – – – – – – – –
Travel and subsistence 5 343 1 173 2 649 3 500 4 783 4 783 4 186 4 264 1 633 (12.5)
Training and development 1 835 1 447 1 017 2 823 2 223 2 223 1 680 1 755 1 800 (24.4)
Operating payments 606 397 934 495 595 666 865 915 949 29.9
Venues and facilities 507 71 251 400 400 578 300 300 313 (48.1)
Rental and hiring – – – – – – – – –
Interest and rent on land – – – – – – – – –
Interest – – – – – – – – –
Rent on land – – – – – – – – –
Transfers and subsidies 1 046 701 2 208 100 100 118 663 205 214 464.3
Provinces and municipalities – – – – – – – – –
Provinces – – – – – – – – –
Provincial Revenue Funds – – – – – – – – –
Provincial agencies and funds – – – – – – – – –
Municipalities – – – – – – – – –
Municipalities – – – – – – – – –
Municipal agencies and funds – – – – – – – – –
Departmental agencies and accounts – – – – – – – – –
Social security funds – – – – – – – – –
Provide list of entities receiving transfers – – – – – – – – –
Higher education institutions – – – – – – – – –
Foreign governments and international organisations – – – – – – – – –
Public corporations and private enterprises – – – – – – – – –
Public corporations – – – – – – – – –
Subsidies on production – – – – – – – – –
Other transfers – – – – – – – – –
Private enterprises – – – – – – – – –
Subsidies on production – – – – – – – – –
Other transfers – – – – – – – – –
Non-profit institutions – – – – – – – – –
Households 1 046 701 2 208 100 100 118 663 205 214 464.3
Social benefits 1 046 701 2 208 100 100 118 663 205 214 464.3
Other transfers to households – – – – – – – – –
Payments for capital assets 6 772 5 915 6 899 13 500 21 241 21 242 12 700 17 575 4 863 (40.2)
Buildings and other fixed structures – – – – – – – – –
Buildings – – – – – – – – –
Other fixed structures – – – – – – – – –
Machinery and equipment 6 772 5 915 6 899 13 500 21 241 21 242 12 700 17 575 4 863 (40.2)
Transport equipment 2 907 5 402 4 788 2 760 6 965 6 965 5 500 5 739 2 997 (21.0)
Other machinery and equipment 3 865 513 2 111 10 740 14 276 14 277 7 200 11 836 1 866 (49.6)
Heritage Assets – – – – – – – – –
Specialised military assets – – – – – – – – –
Biological assets – – – – – – – – –
Land and sub-soil assets – – – – – – – – –
Software and other intangible assets – – – – – – – – –
Payments for financial assets – – – – – – – – –
Total economic classification 158 429 145 453 151 712 175 406 192 006 192 542 177 875 198 462 165 569 (7.6)
595