
Page 615 - Provincial Treasury Estimates.pdf
P. 615
Estimates of the Provincial Revenue and Expenditure (EPRE) – 2023/24 Financial Year
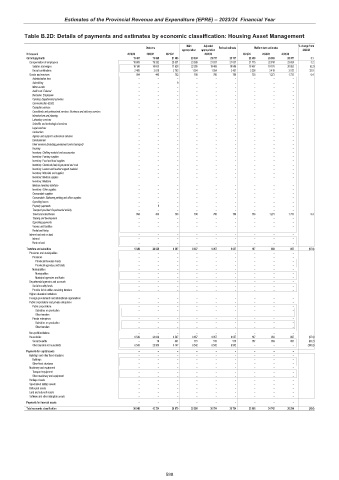
Table B.2D: Details of payments and estimates by economic classification: Housing Asset Management
Main Adjusted % change from
Outcome Revised estimate Medium-term estimates
appropriation appropriation 2022/23
R thousand 2019/20 2020/21 2021/22 2022/23 2023/24 2024/25 2025/26
Current payments 19 497 19 695 21 083 23 939 21 737 21 737 22 418 23 883 25 357 3.1
Compensation of employees 18 603 19 252 20 331 23 839 21 037 21 037 21 715 22 610 23 624 3.2
Salaries and wages 16 198 16 633 17 628 22 285 19 483 18 586 18 457 19 191 20 052 (0.7)
Social contributions 2 405 2 619 2 703 1 554 1 554 2 451 3 258 3 419 3 572 32.9
Goods and services 894 443 752 100 700 700 703 1 273 1 733 0.4
Administrative fees – – – – – – – – –
Advertising – – 9 – – – – – –
Minor assets – – – – – – – – –
Audit cost: External – – – – – – – – –
Bursaries: Employees – – – – – – – – –
Catering: Departmental activities – – – – – – – – –
Communication (G&S) – – – – – – – – –
Computer services – – – – – – – – –
Consultants and professional services: Business and advisory services – – – – – – – – –
Infrastructure and planning – – – – – – – – –
Laboratory services – – – – – – – – –
Scientific and technological services – – – – – – – – –
Legal services – – – – – – – – –
Contractors – – – – – – – – –
Agency and support / outsourced services – – – – – – – – –
Entertainment – – – – – – – – –
Fleet services (including government motor transport) – – – – – – – – –
Housing – – – – – – – – –
Inventory: Clothing material and accessories – – – – – – – – –
Inventory: Farming supplies – – – – – – – – –
Inventory: Food and food supplies – – – – – – – – –
Inventory: Chemicals,fuel,oil,gas,wood and coal – – – – – – – – –
Inventory: Learner and teacher support material – – – – – – – – –
Inventory: Materials and supplies – – – – – – – – –
Inventory: Medical supplies – – – – – – – – –
Inventory: Medicine – – – – – – – – –
Medsas inventory interface – – – – – – – – –
Inventory: Other supplies – – – – – – – – –
Consumable supplies – – – – – – – – –
Consumable: Stationery,printing and office supplies – – – – – – – – –
Operating leases – – – – – – – – –
Property payments – 9 – – – – – – –
Transport provided: Departmental activity – – – – – – – – –
Travel and subsistence 894 434 743 100 700 700 703 1 273 1 733 0.4
Training and development – – – – – – – – –
Operating payments – – – – – – – – –
Venues and facilities – – – – – – – – –
Rental and hiring – – – – – – – – –
Interest and rent on land – – – – – – – – –
Interest – – – – – – – – –
Rent on land – – – – – – – – –
Transfers and subsidies 6 549 24 029 9 587 8 657 9 057 9 057 187 859 897 (97.9)
Provinces and municipalities – – – – – – – – –
Provinces – – – – – – – – –
Provincial Revenue Funds – – – – – – – – –
Provincial agencies and funds – – – – – – – – –
Municipalities – – – – – – – – –
Municipalities – – – – – – – – –
Municipal agencies and funds – – – – – – – – –
Departmental agencies and accounts – – – – – – – – –
Social security funds – – – – – – – – –
Provide list of entities receiving transfers – – – – – – – – –
Higher education institutions – – – – – – – – –
Foreign governments and international organisations – – – – – – – – –
Public corporations and private enterprises – – – – – – – – –
Public corporations – – – – – – – – –
Subsidies on production – – – – – – – – –
Other transfers – – – – – – – – –
Private enterprises – – – – – – – – –
Subsidies on production – – – – – – – – –
Other transfers – – – – – – – – –
Non-profit institutions – – – – – – – – –
Households 6 549 24 029 9 587 8 657 9 057 9 057 187 859 897 (97.9)
Social benefits – 79 441 115 515 515 187 859 897 (63.7)
Other transfers to households 6 549 23 950 9 147 8 542 8 542 8 542 – – – (100.0)
Payments for capital assets – – – – – – – – –
Buildings and other fixed structures – – – – – – – – –
Buildings – – – – – – – – –
Other fixed structures – – – – – – – – –
Machinery and equipment – – – – – – – – –
Transport equipment – – – – – – – – –
Other machinery and equipment – – – – – – – – –
Heritage Assets – – – – – – – – –
Specialised military assets – – – – – – – – –
Biological assets – – – – – – – – –
Land and sub-soil assets – – – – – – – – –
Software and other intangible assets – – – – – – – – –
Payments for financial assets – – – – – – – – –
Total economic classification 26 046 43 724 30 670 32 596 30 794 30 794 22 605 24 742 26 254 (26.6)
598