
Page 665 - Provincial Treasury Estimates.pdf
P. 665
Estimates of the Provincial Revenue and Expenditure (EPRE) – 2023/24 Financial Year
and Liability Management, enhance, monitor and enforce transparent and effective SCM and Asset
Management.
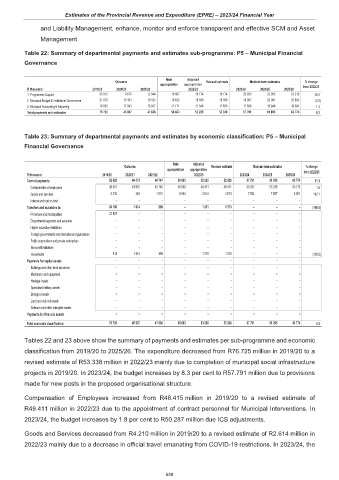
Table 22: Summary of departmental payments and estimates sub-programme: P5 – Municipal Financial
Governance
Main Adjusted
Outcome Revised estimate Medium-term estimates % change
appropriation appropriation from 2022/23
R thousand 2019/20 2020/21 2021/22 2022/23 2023/24 2024/25 2025/26
1. Programme Support 35 912 9 675 12 044 19 887 16 174 16 174 20 925 22 065 23 218 29.4
2. Municipal Budget & Institutional Governance 21 878 19 161 19 535 19 635 19 506 19 506 18 967 20 081 20 865 (2.8)
3. Municipal Accounting & Reporting 18 935 17 091 16 057 17 171 17 546 17 658 17 899 18 949 19 691 1.4
Total payments and estimates 76 725 45 927 47 636 56 693 53 226 53 338 57 791 61 095 63 774 8.3
Table 23: Summary of departmental payments and estimates by economic classification: P5 – Municipal
Financial Governance
Main Adjusted
Outcome Revised estimate Medium-term estimates % change
appropriation appropriation from 2022/23
R thousand 2019/20 2020/21 2021/22 2022/23 2023/24 2024/25 2025/26
Current payments 52 625 44 313 46 747 56 693 52 025 52 025 57 791 61 095 63 774 11.1
Compensation of employees 48 415 43 967 45 746 50 049 49 411 49 411 50 287 53 238 55 773 1.8
Goods and services 4 210 346 1 001 6 644 2 614 2 614 7 504 7 857 8 001 187.1
Interest and rent on land – – – – – – – – –
Transfers and subsidies to: 24 100 1 614 889 – 1 201 1 313 – – – (100.0)
Provinces and municipalities 23 587 – – – – – – – –
Departmental agencies and accounts – – – – – – – – –
Higher education institutions – – – – – – – – –
Foreign governments and international organisations – – – – – – – – –
Public corporations and private enterprises – – – – – – – – –
Non-profit institutions – – – – – – – – –
Households 513 1 614 889 – 1 201 1 313 – – – (100.0)
Payments for capital assets – – – – – – – – –
Buildings and other fixed structures – – – – – – – – –
Machinery and equipment – – – – – – – – –
Heritage Assets – – – – – – – – –
Specialised military assets – – – – – – – – –
Biological assets – – – – – – – – –
Land and sub-soil assets – – – – – – – – –
Software and other intangible assets – – – – – – – – –
Payments for financial assets – – – – – – – – –
Total economic classification 76 725 45 927 47 636 56 693 53 226 53 338 57 791 61 095 63 774 8.3
Tables 22 and 23 above show the summary of payments and estimates per sub-programme and economic
classification from 2019/20 to 2025/26. The expenditure decreased from R76.725 million in 2019/20 to a
revised estimate of R53.338 million in 2022/23 mainly due to completion of municipal social infrastructure
projects in 2019/20. In 2023/24, the budget increases by 8.3 per cent to R57.791 million due to provisions
made for new posts in the proposed organisational structure.
Compensation of Employees increased from R48.415 million in 2019/20 to a revised estimate of
R49.411 million in 2022/23 due to the appointment of contract personnel for Municipal Interventions. In
2023/24, the budget increases by 1.8 per cent to R50.287 million due ICS adjustments.
Goods and Services decreased from R4.210 million in 2019/20 to a revised estimate of R2.614 million in
2022/23 mainly due to a decrease in official travel emanating from COVID-19 restrictions. In 2023/24, the
648