
Page 663 - Provincial Treasury Estimates.pdf
P. 663
Estimates of the Provincial Revenue and Expenditure (EPRE) – 2023/24 Financial Year
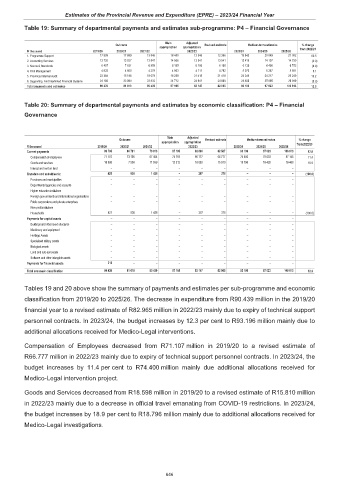
Table 19: Summary of departmental payments and estimates sub-programme: P4 – Financial Governance
Main Adjusted
Outcome Revised estimate Medium-term estimates % change
appropriation appropriation from 2022/23
R thousand 2019/20 2020/21 2021/22 2022/23 2023/24 2024/25 2025/26
1. Programme Support 17 909 17 889 13 845 18 480 12 346 12 366 19 842 20 849 27 382 60.5
2. Accounting Services 13 720 13 027 13 847 14 566 13 541 13 541 13 419 14 197 14 750 (0.9)
3. Norms & Standards 6 407 7 821 6 958 6 185 6 190 6 190 6 136 6 498 6 752 (0.9)
4. Risk Management 4 833 4 600 4 278 4 863 4 711 4 782 5 073 5 367 5 581 6.1
5. Provincial Internal Audit 23 384 15 188 18 678 18 299 21 418 21 418 24 246 24 217 25 249 13.2
6. Supporting And Interlinked Financial Systems 24 186 23 094 22 833 24 712 24 941 24 668 24 480 25 895 26 899 (0.8)
Total payments and estimates 90 439 81 619 80 439 87 105 83 147 82 965 93 196 97 023 106 613 12.3
Table 20: Summary of departmental payments and estimates by economic classification: P4 – Financial
Governance
Main Adjusted
Outcome Revised estimate Medium-term estimates % change
appropriation appropriation from 2022/23
R thousand 2019/20 2020/21 2021/22 2022/23 2023/24 2024/25 2025/26
Current payments 89 705 80 781 79 013 87 105 82 860 82 587 93 196 97 023 106 613 12.8
Compensation of employees 71 107 73 195 67 454 74 793 66 777 66 777 74 400 78 603 87 145 11.4
Goods and services 18 598 7 586 11 559 12 312 16 083 15 810 18 796 18 420 19 468 18.9
Interest and rent on land – – – – – – – – –
Transfers and subsidies to: 421 838 1 426 – 287 378 – – – (100.0)
Provinces and municipalities – – – – – – – – –
Departmental agencies and accounts – – – – – – – – –
Higher education institutions – – – – – – – – –
Foreign governments and international organisations – – – – – – – – –
Public corporations and private enterprises – – – – – – – – –
Non-profit institutions – – – – – – – – –
Households 421 838 1 426 – 287 378 – – – (100.0)
Payments for capital assets – – – – – – – – –
Buildings and other fixed structures – – – – – – – – –
Machinery and equipment – – – – – – – – –
Heritage Assets – – – – – – – – –
Specialised military assets – – – – – – – – –
Biological assets – – – – – – – – –
Land and sub-soil assets – – – – – – – – –
Software and other intangible assets – – – – – – – – –
Payments for financial assets 313 – – – – – – – –
Total economic classification 90 439 81 619 80 439 87 105 83 147 82 965 93 196 97 023 106 613 12.3
Tables 19 and 20 above show the summary of payments and estimates per sub-programme and economic
classification from 2019/20 to 2025/26. The decrease in expenditure from R90.439 million in the 2019/20
financial year to a revised estimate of R82.965 million in 2022/23 mainly due to expiry of technical support
personnel contracts. In 2023/24, the budget increases by 12.3 per cent to R93.196 million mainly due to
additional allocations received for Medico-Legal interventions.
Compensation of Employees decreased from R71.107 million in 2019/20 to a revised estimate of
R66.777 million in 2022/23 mainly due to expiry of technical support personnel contracts. In 2023/24, the
budget increases by 11.4 per cent to R74.400 million mainly due additional allocations received for
Medico-Legal intervention project.
Goods and Services decreased from R18.598 million in 2019/20 to a revised estimate of R15.810 million
in 2022/23 mainly due to a decrease in official travel emanating from COVID-19 restrictions. In 2023/24,
the budget increases by 18.9 per cent to R18.796 million mainly due to additional allocations received for
Medico-Legal investigations.
646