
Page 667 - Provincial Treasury Estimates.pdf
P. 667
Estimates of the Provincial Revenue and Expenditure (EPRE) – 2023/24 Financial Year
9.2 Personnel numbers and costs by component
Table 26: Personnel numbers and costs by component
Actual Revised estimate Medium-term expenditure estimate Average annual growth over MTEF
2019/20 2020/21 2021/22 2022/23 2023/24 2024/25 2025/26 2022/23 - 2025/26
% Costs
Personnel Costs Personnel Costs Personnel Costs Filled Additional Personnel Costs Personnel Costs Personnel Costs Personnel Costs Personnel Costs growth of
numbers 1 numbers 1 numbers 1 posts posts numbers 1 numbers 1 numbers 1 numbers 1 growth rate rate
R thousands Total
Salary level
1 – 7 93 6 933 82 27 320 80 31 064 77 9 86 31 772 92 34 960 92 37 025 92 38 257 2.3% 6.4% 10.1%
8 – 10 163 122 446 160 92 088 157 92 341 153 4 157 91 648 155 92 706 155 98 240 155 100 935 -0.4% 3.3% 27.6%
11 – 12 121 105 756 111 109 390 113 108 787 115 8 123 111 794 131 117 727 131 124 552 131 136 175 2.1% 6.8% 35.3%
13 – 16 64 85 864 66 87 013 63 84 585 52 15 67 88 057 66 87 150 66 92 555 66 96 534 -0.5% 3.1% 26.3%
Other 43 1 351 26 2 619 34 2 501 27 – 27 1 971 37 2 832 37 2 889 37 3 018 11.1% 15.3% 0.7%
Total 484 322 350 445 318 430 447 319 278 424 36 460 325 242 481 335 375 481 355 261 481 374 919 1.5% 4.9% 100.0%
Programme
1. Administration 194 110 039 177 110 133 189 111 493 197 – 197 115 030 203 115 017 203 122 142 203 126 809 1.0% 3.3% 34.5%
2. Sustainable Resource Management 85 68 050 83 68 690 82 70 857 73 8 81 70 653 83 71 617 83 75 817 83 78 744 0.8% 3.7% 21.3%
3. Asset And Liability 32 24 739 30 22 445 31 23 728 31 2 33 23 371 33 24 054 33 25 461 33 26 448 – 4.2% 7.1%
4. Financial Governance 97 71 107 87 73 195 80 67 454 64 23 87 66 777 97 74 400 97 78 603 97 87 145 3.7% 9.3% 22.0%
5. Municipal Financial Governance 76 48 415 68 43 967 65 45 746 59 3 62 49 411 65 50 287 65 53 238 65 55 773 1.6% 4.1% 15.0%
Direct charges – – – – – – – – – – – – – – – – – – –
Total 484 322 350 445 318 430 447 319 278 424 36 460 325 242 481 335 375 481 355 261 481 374 919 1.5% 4.9% 100.0%
Employee dispensation classification
Public Service Act appointees not covered by 440 319 998 418 315 450 415 316 086 423 9 432 322 394 443 331 627 443 351 415 443 370 901 0.8% 4.8% 99.0%
OSDs
Public Service Act appointees still to be covered 1 1 001 1 761 1 817 1 – 1 877 1 916 1 957 1 1 000 – 4.5% 0.3%
by OSDs
Professional Nurses, Staff Nurses and Nursing – – – – – – – – – – – – – – – – – – –
Assistants
Legal Professionals – – – – – – – – – – – – – – – – – – –
Social Services Professions – – – – – – – – – – – – – – – – – – –
Engineering Professions and related occupations – – – – – – – – – – – – – – – – – – –
Medical and related professionals – – – – – – – – – – – – – – – – – – –
Therapeutic, Diagnostic and other related Allied – – – – – – – – – – – – – – – – – – –
Health Professionals
Educators and related professionals – – – – – – – – – – – – – – – – – – –
Others such as interns, EPWP, learnerships, etc 43 1 351 26 2 219 31 2 375 – 27 27 1 971 37 2 832 37 2 889 37 3 018 11.1% 15.3% 0.7%
Total 484 322 350 445 318 430 447 319 278 424 36 460 325 242 481 335 375 481 355 261 481 374 919 1.5% 4.9% 100.0%
1. Personnel numbers includes all filled posts together with those posts additional to the approved establishment
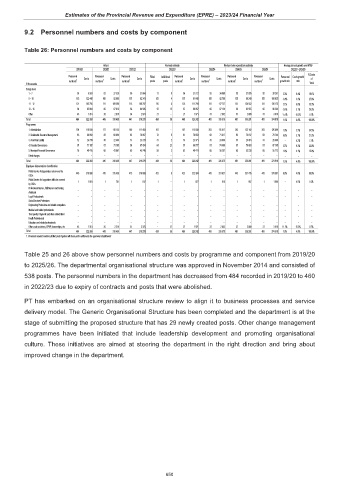
Table 25 and 26 above show personnel numbers and costs by programme and component from 2019/20
to 2025/26. The departmental organisational structure was approved in November 2014 and consisted of
538 posts. The personnel numbers in the department has decreased from 484 recorded in 2019/20 to 460
in 2022/23 due to expiry of contracts and posts that were abolished.
PT has embarked on an organisational structure review to align it to business processes and service
delivery model. The Generic Organisational Structure has been completed and the department is at the
stage of submitting the proposed structure that has 29 newly created posts. Other change management
programmes have been initiated that include leadership development and promoting organisational
culture. These initiatives are aimed at steering the department in the right direction and bring about
improved change in the department.
650