
Page 661 - Provincial Treasury Estimates.pdf
P. 661
Estimates of the Provincial Revenue and Expenditure (EPRE) – 2023/24 Financial Year
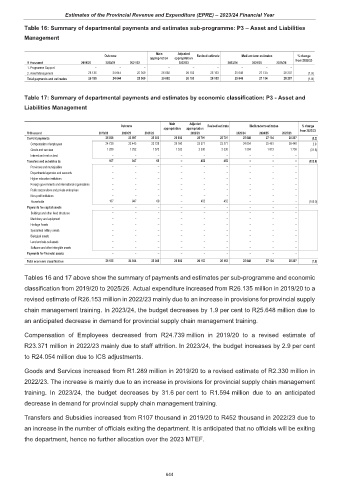
Table 16: Summary of departmental payments and estimates sub-programme: P3 – Asset and Liabilities
Management
Main Adjusted
Outcome Revised estimate Medium-term estimates % change
appropriation appropriation
R thousand 2019/20 2020/21 2021/22 2022/23 2023/24 2024/25 2025/26 from 2022/23
1. Programme Support – – – – – – – – –
2. Asset Management 26 135 24 644 25 369 26 692 26 153 26 153 25 648 27 134 28 207 (1.9)
Total payments and estimates 26 135 24 644 25 369 26 692 26 153 26 153 25 648 27 134 28 207 (1.9)
Table 17: Summary of departmental payments and estimates by economic classification: P3 - Asset and
Liabilities Management
Main Adjusted
Outcome Revised estimate Medium-term estimates % change
appropriation appropriation
R thousand 2019/20 2020/21 2021/22 2022/23 2023/24 2024/25 2025/26 from 2022/23
Current payments 26 028 23 697 25 300 26 692 25 701 25 701 25 648 27 134 28 207 (0.2)
Compensation of employees 24 739 22 445 23 728 25 160 23 371 23 371 24 054 25 461 26 448 2.9
Goods and services 1 289 1 252 1 572 1 532 2 330 2 330 1 594 1 673 1 759 (31.6)
Interest and rent on land – – – – – – – – –
Transfers and subsidies to: 107 947 69 – 452 452 – – – (100.0)
Provinces and municipalities – – – – – – – – –
Departmental agencies and accounts – – – – – – – – –
Higher education institutions – – – – – – – – –
Foreign governments and international organisations – – – – – – – – –
Public corporations and private enterprises – – – – – – – – –
Non-profit institutions – – – – – – – – –
Households 107 947 69 – 452 452 – – – (100.0)
Payments for capital assets – – – – – – – – –
Buildings and other fixed structures – – – – – – – – –
Machinery and equipment – – – – – – – – –
Heritage Assets – – – – – – – – –
Specialised military assets – – – – – – – – –
Biological assets – – – – – – – – –
Land and sub-soil assets – – – – – – – – –
Software and other intangible assets – – – – – – – – –
Payments for financial assets – – – – – – – – –
Total economic classification 26 135 24 644 25 369 26 692 26 153 26 153 25 648 27 134 28 207 (1.9)
Tables 16 and 17 above show the summary of payments and estimates per sub-programme and economic
classification from 2019/20 to 2025/26. Actual expenditure increased from R26.135 million in 2019/20 to a
revised estimate of R26.153 million in 2022/23 mainly due to an increase in provisions for provincial supply
chain management training. In 2023/24, the budget decreases by 1.9 per cent to R25.648 million due to
an anticipated decrease in demand for provincial supply chain management training.
Compensation of Employees decreased from R24.739 million in 2019/20 to a revised estimate of
R23.371 million in 2022/23 mainly due to staff attrition. In 2023/24, the budget increases by 2.9 per cent
to R24.054 million due to ICS adjustments.
Goods and Services increased from R1.289 million in 2019/20 to a revised estimate of R2.330 million in
2022/23. The increase is mainly due to an increase in provisions for provincial supply chain management
training. In 2023/24, the budget decreases by 31.6 per cent to R1.594 million due to an anticipated
decrease in demand for provincial supply chain management training.
Transfers and Subsidies increased from R107 thousand in 2019/20 to R452 thousand in 2022/23 due to
an increase in the number of officials exiting the department. It is anticipated that no officials will be exiting
the department, hence no further allocation over the 2023 MTEF.
644