
Page 699 - Provincial Treasury Estimates.pdf
P. 699
Estimates of the Provincial Revenue and Expenditure (EPRE) – 2023/24 Financial Year
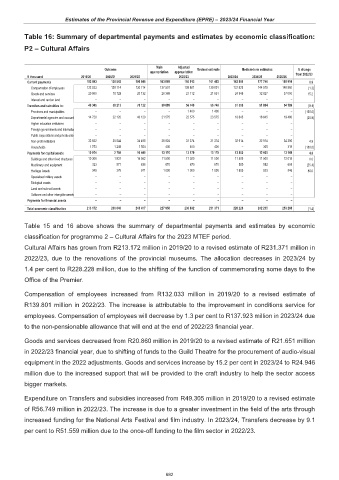
Table 16: Summary of departmental payments and estimates by economic classification:
P2 – Cultural Affairs
Main Adjusted
Outcome Revised estimate Medium-term estimates % change
appropriation appropriation
R thousand 2019/20 2020/21 2021/22 2022/23 2023/24 2024/25 2025/26 from 2022/23
Current payments 152 893 138 843 150 846 163 889 160 913 161 452 162 869 177 746 185 910 0.9
Compensation of employees 132 033 128 114 130 714 137 501 139 801 139 801 137 923 144 919 148 860 (1.3)
Goods and services 20 860 10 729 20 132 26 388 21 112 21 651 24 946 32 827 37 050 15.2
Interest and rent on land – – – – – – – – –
Transfers and subsidies to: 49 305 59 213 76 122 50 899 56 749 56 749 51 559 51 864 54 189 (9.1)
Provinces and municipalities – – – – 1 400 1 400 – – – (100.0)
Departmental agencies and accounts 14 720 22 120 40 120 21 575 23 575 23 575 18 645 18 645 19 480 (20.9)
Higher education institutions – – – – – – – – –
Foreign governments and internation – – – – – – – – –
Public corporations and private ente – – – – – – – – –
Non-profit institutions 32 832 35 844 34 498 28 924 31 374 31 374 32 914 32 914 34 390 4.9
Households 1 753 1 249 1 504 400 400 400 – 305 319 (100.0)
Payments for capital assets 10 974 2 784 16 449 13 170 13 170 13 170 13 800 12 605 13 169 4.8
Buildings and other fixed structures 10 306 1 937 14 842 11 500 11 500 11 500 11 500 11 500 12 015 0.0
Machinery and equipment 323 571 636 670 670 670 500 582 608 (25.4)
Heritage Assets 345 276 971 1 000 1 000 1 000 1 800 523 546 80.0
Specialised military assets – – – – – – – – –
Biological assets – – – – – – – – –
Land and sub-soil assets – – – – – – – – –
Software and other intangible assets – – – – – – – – –
Payments for financial assets – – – – – – – – –
Total economic classification 213 172 200 840 243 417 227 958 230 832 231 371 228 228 242 215 253 268 (1.4)
Table 15 and 16 above shows the summary of departmental payments and estimates by economic
classification for programme 2 – Cultural Affairs for the 2023 MTEF period.
Cultural Affairs has grown from R213.172 million in 2019/20 to a revised estimate of R231.371 million in
2022/23, due to the renovations of the provincial museums. The allocation decreases in 2023/24 by
1.4 per cent to R228.228 million, due to the shifting of the function of commemorating some days to the
Office of the Premier.
Compensation of employees increased from R132.033 million in 2019/20 to a revised estimate of
R139.801 million in 2022/23. The increase is attributable to the improvement in conditions service for
employees. Compensation of employees will decrease by 1.3 per cent to R137.923 million in 2023/24 due
to the non-pensionable allowance that will end at the end of 2022/23 financial year.
Goods and services decreased from R20.860 million in 2019/20 to a revised estimate of R21.651 million
in 2022/23 financial year, due to shifting of funds to the Guild Theatre for the procurement of audio-visual
equipment in the 2022 adjustments. Goods and services increase by 15.2 per cent in 2023/24 to R24.946
million due to the increased support that will be provided to the craft industry to help the sector access
bigger markets.
Expenditure on Transfers and subsidies increased from R49.305 million in 2019/20 to a revised estimate
of R56.749 million in 2022/23. The increase is due to a greater investment in the field of the arts through
increased funding for the National Arts Festival and film industry. In 2023/24, Transfers decrease by 9.1
per cent to R51.559 million due to the once-off funding to the film sector in 2022/23.
682