
Page 697 - Provincial Treasury Estimates.pdf
P. 697
Estimates of the Provincial Revenue and Expenditure (EPRE) – 2023/24 Financial Year
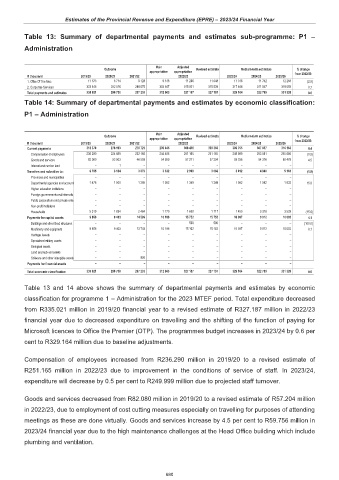
Table 13: Summary of departmental payments and estimates sub-programme: P1 –
Administration
Main Adjusted
Outcome Revised estimate Medium-term estimates % change
appropriation appropriation
R thousand 2019/20 2020/21 2021/22 2022/23 2023/24 2024/25 2025/26 from 2022/23
1. Office Of The Mec 11 573 8 714 9 128 9 316 11 266 11 648 11 316 11 742 12 268 (2.9)
2. Corporate Services 323 448 282 016 288 075 303 647 315 921 315 539 317 848 311 047 319 058 0.7
Total payments and estimates 335 021 290 730 297 203 312 963 327 187 327 187 329 164 322 789 331 326 0.6
Table 14: Summary of departmental payments and estimates by economic classification:
P1 – Administration
Main Adjusted
Outcome Revised estimate Medium-term estimates % change
appropriation appropriation from 2022/23
R thousand 2019/20 2020/21 2021/22 2022/23 2023/24 2024/25 2025/26
Current payments 318 370 278 193 278 725 299 445 308 436 308 369 309 755 307 937 316 163 0.4
Compensation of employees 236 290 224 689 232 166 244 486 251 165 251 165 249 999 253 561 255 685 (0.5)
Goods and services 82 080 53 503 46 559 54 959 57 271 57 204 59 756 54 376 60 478 4.5
Interest and rent on land – 1 – – – – – – –
Transfers and subsidies to: 6 795 3 134 3 879 3 332 2 999 3 066 3 012 4 940 5 161 (1.8)
Provinces and municipalities – – – – – – – – –
Departmental agencies and accounts 1 476 1 500 1 395 1 562 1 349 1 349 1 562 1 562 1 632 15.8
Higher education institutions – – – – – – – – –
Foreign governments and internation – – – – – – – – –
Public corporations and private ente – – – – – – – – –
Non-profit institutions – – – – – – – – –
Households 5 319 1 634 2 484 1 770 1 650 1 717 1 450 3 378 3 529 (15.6)
Payments for capital assets 9 856 9 403 14 599 10 186 15 752 15 752 16 397 9 912 10 002 4.1
Buildings and other fixed structures – – – – 590 590 – – – (100.0)
Machinery and equipment 9 856 9 403 13 743 10 186 15 162 15 162 16 397 9 912 10 002 8.1
Heritage Assets – – – – – – – – –
Specialised military assets – – – – – – – – –
Biological assets – – – – – – – – –
Land and sub-soil assets – – – – – – – – –
Software and other intangible assets – – 856 – – – – – –
Payments for financial assets – – – – – – – – –
Total economic classification 335 021 290 730 297 203 312 963 327 187 327 187 329 164 322 789 331 326 0.6
Table 13 and 14 above shows the summary of departmental payments and estimates by economic
classification for programme 1 – Administration for the 2023 MTEF period. Total expenditure decreased
from R335.021 million in 2019/20 financial year to a revised estimate of R327.187 million in 2022/23
financial year due to decreased expenditure on travelling and the shifting of the function of paying for
Microsoft licences to Office the Premier (OTP). The programmes budget increases in 2023/24 by 0.6 per
cent to R329.164 million due to baseline adjustments.
Compensation of employees increased from R236.290 million in 2019/20 to a revised estimate of
R251.165 million in 2022/23 due to improvement in the conditions of service of staff. In 2023/24,
expenditure will decrease by 0.5 per cent to R249.999 million due to projected staff turnover.
Goods and services decreased from R82.080 million in 2019/20 to a revised estimate of R57.204 million
in 2022/23, due to employment of cost cutting measures especially on travelling for purposes of attending
meetings as these are done virtually. Goods and services increase by 4.5 per cent to R59.756 million in
2023/24 financial year due to the high maintenance challenges at the Head Office building which include
plumbing and ventilation.
680