Page 733 - Provincial Treasury Estimates.pdf
P. 733

Estimates of the Provincial Revenue and Expenditure (EPRE) – 2023/24  Financial Year

           7. 7. Payment summary


           7.1   Key assumptions


           The following assumptions were taken into consideration when the budget was formulated:
            x   Cost of Living Adjustment  for  the envisaged  salary bargaining council between the state and
                employees;
            x   Consumer Price Index (CPI) as contained in the Provincial Treasury’s budget guidelines;

            x   Commitment to the implementation of the  cost containment measures; and

            x   Adequate provision for compensation of employees and contractual obligations.


           7.2   Programme summary

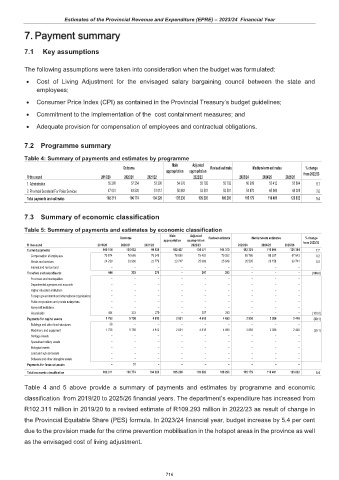
           Table 4: Summary of payments and estimates by programme
                                                               Main   Adjusted
                                              Outcome                        Revised estimate  Medium-term estimates  % change
                                                             appropriation  appropriation
            R thousand                2019/20  2020/21  2021/22        2022/23         2023/24  2024/25  2025/26  from 2022/23
            1. Administration                         55 280                  57 254                  53 208                  54 376                  55 792                  55 792                  60 309                  53 412                  55 804  8.1
            2. Provincial Secretariat For Police Services                   47 031                  49 520                  51 012                  50 862                  53 501                  53 501                  54 870                  65 069                  68 028  2.6
            Total payments and estimates                 102 311                106 774                104 220                105 238                109 293                109 293                115 179                118 481                123 832  5.4


           7.3   Summary of economic classification

           Table 5: Summary of payments and estimates by economic classification
                                                              Main   Adjusted
                                             Outcome                        Revised estimate  Medium-term estimates  % change
                                                            appropriation  appropriation
            R thousand               2019/20  2020/21  2021/22        2022/23         2023/24  2024/25  2025/26  from 2022/23
            Current payments                      100 104                 100 632                   99 128                 102 437                 104 471                 104 310                 112 321                 116 095                 121 384  7.7
             Compensation of employees                    75 874                   76 666                   76 349                   78 690                   79 402                   79 262                   85 786                   86 937                   87 643  8.2
             Goods and services                     24 230                   23 966                   22 779                   23 747                   25 069                   25 048                   26 535                   29 158                   33 741  5.9
             Interest and rent on land                             –                            –                            –                            –                            –                            –                            –                            –                            –
            Transfers and subsidies to:                        444                        333                        279                            –                        207                        293                            –                            –                            –  (100.0)
             Provinces and municipalities                             –                            –                            –                            –                            –                            –                            –                            –                            –
             Departmental agencies and accounts                            –                            –                            –                            –                            –                            –                            –                            –                            –
             Higher education institutions                            –                            –                            –                            –                            –                            –                            –                            –                            –
             Foreign governments and international organisations                           –                            –                            –                            –                            –                            –                            –                            –                            –
             Public corporations and private enterprises                            –                            –                            –                            –                            –                            –                            –                            –                            –
             Non-profit institutions                            –                            –                            –                            –                            –                            –                            –                            –                            –
             Households                                  444                        333                        279                            –                        207                        293                            –                            –                            –  (100.0)
            Payments for capital assets                     1 763                     5 758                     4 813                     2 801                     4 615                     4 690                     2 858                     2 386                     2 448  (39.1)
             Buildings and other fixed structures                          38                            –                            –                            –                            –                            –                            –                            –                            –
             Machinery and equipment                     1 725                     5 758                     4 813                     2 801                     4 615                     4 690                     2 858                     2 386                     2 448  (39.1)
             Heritage Assets                                 –                            –                            –                            –                            –                            –                            –                            –                            –
             Specialised military assets                            –                            –                            –                            –                            –                            –                            –                            –                            –
             Biological assets                               –                            –                            –                            –                            –                            –                            –                            –                            –
             Land and sub-soil assets                            –                            –                            –                            –                            –                            –                            –                            –                            –
              Software and other intangible assets                            –                            –                            –                            –                            –                            –                            –                            –                            –
            Payments for financial assets                            –                          51                            –                            –                            –                            –                            –                            –                            –
            Total economic classification                 102 311                 106 774                 104 220                 105 238                 109 293                 109 293                 115 179                 118 481                 123 832  5.4

           Table 4 and 5 above provide a summary of payments  and  estimates by programme and economic

           classification  from 2019/20 to 2025/26 financial years. The department’s expenditure has increased from
           R102.311 million in 2019/20 to a revised estimate of R109.293 million in 2022/23 as result of change in
           the Provincial Equitable Share (PES) formula. In 2023/24 financial year, budget increase by 5.4 per cent

           due to the provision made for the crime prevention mobilisation in the hotspot areas in the province as well
           as the envisaged cost of living adjustment.


                                                             716
   728   729   730   731   732   733   734   735   736   737   738