
Page 737 - Provincial Treasury Estimates.pdf
P. 737
Estimates of the Provincial Revenue and Expenditure (EPRE) – 2023/24 Financial Year
8. 8. Programme description
8.1 Programme 1: Administration
Objectives: To promote good governance and administrative support to the department. It
consists of four sub-programmes, namely:
x Office of the MEC provides administrative and support services to the MEC;
x Office of the Head of the Department provides strategic and administrative leadership to the
department;
x Financial Management ensures departmental financial compliance through the provision of
financial management and advisory services; and
x Corporate Services enhances departmental effectiveness through providing Information
Communication Technology, Human Resource Management, Departmental Communication and
Strategic Management.
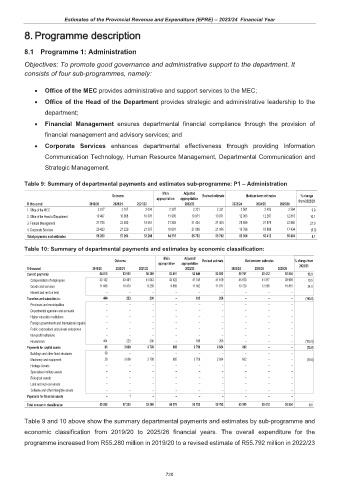
Table 9: Summary of departmental payments and estimates sub-programme: P1 – Administration
Main Adjusted
Outcome Revised estimate Medium-term estimates % change
appropriation appropriation
R thousand 2019/20 2020/21 2021/22 2022/23 2023/24 2024/25 2025/26 from 2022/23
1. Office of the MEC 2 617 2 187 2 004 2 387 2 331 2 331 2 561 2 483 2 594 9.9
2. Office of the Head of Department 10 497 10 908 10 376 11 905 10 971 10 971 12 083 12 267 12 816 10.1
3. Finacial Management 21 743 22 930 19 461 21 393 21 404 21 404 25 899 21 976 22 960 21.0
4. Corporate Services 20 423 21 229 21 367 18 691 21 086 21 086 19 766 16 686 17 434 (6.3)
Total payments and estimates 55 280 57 254 53 208 54 376 55 792 55 792 60 309 53 412 55 804 8.1
Table 10: Summary of departmental payments and estimates by economic classification:
Main Adjusted
Outcome Revised estimate Medium-term estimates % change from
appropriation appropriation 2022/23
R thousand 2019/20 2020/21 2021/22 2022/23 2023/24 2024/25 2025/26
Current payments 54 810 53 931 50 299 53 411 52 840 52 690 59 707 53 412 55 804 13.3
Compensation of employees 43 142 43 461 41 043 43 522 41 748 41 619 45 978 41 317 38 989 10.5
Goods and services 11 668 10 470 9 256 9 889 11 092 11 071 13 729 12 095 16 815 24.0
Interest and rent on land – – – – – – – – –
Transfers and subsidies to: 404 223 200 – 193 268 – – – (100.0)
Provinces and municipalities – – – – – – – – –
Departmental agencies and accounts – – – – – – – – –
Higher education institutions – – – – – – – – –
Foreign governments and international organisa – – – – – – – – –
Public corporations and private enterprises – – – – – – – – –
Non-profit institutions – – – – – – – – –
Households 404 223 200 – 193 268 – – – (100.0)
Payments for capital assets 66 3 099 2 709 965 2 759 2 834 602 – – (78.8)
Buildings and other fixed structures 38 – – – – – – – –
Machinery and equipment 28 3 099 2 709 965 2 759 2 834 602 – – (78.8)
Heritage Assets – – – – – – – – –
Specialised military assets – – – – – – – – –
Biological assets – – – – – – – – –
Land and sub-soil assets – – – – – – – – –
Software and other intangible assets – – – – – – – – –
Payments for financial assets – 1 – – – – – – –
Total economic classification 55 280 57 254 53 208 54 376 55 792 55 792 60 309 53 412 55 804 8.1
Table 9 and 10 above show the summary departmental payments and estimates by sub-programme and
economic classification from 2019/20 to 2025/26 financial years. The overall expenditure for the
programme increased from R55.280 million in 2019/20 to a revised estimate of R55.792 million in 2022/23
720