
Page 734 - Provincial Treasury Estimates.pdf
P. 734
Department: of Community Safety
Compensation of employees increased from R75.874 million in 2019/20 to the revised estimate of
R79.262 million in 2022/23 due to provision for cost of living adjustments. In 2023/24, the budget will
increase by 8.2 per cent as a result of the impact of new data updates in the PES formula and the additional
allocation for the wage agreement.
Goods and services increased from R24.230 million in 2019/20 to the revised estimate of R25.048 million
in 2022/23 due to provision for contractual obligations. In 2023/24, the budget increases by 5.9 per cent
due to the additional funding for the crime prevention mobilisation in the hotspot areas.
Transfers and subsidies decreased from R444 thousand 2019/20 to a revised estimate of R293 thousand
in 2022/23 due to the decrease of employees exiting the department.
Payments for capital assets increased from R1.763 million in 2019/20 to the revised estimate of
R4.690 million in 2022/23 due to provision to investment in the Information Communication Technology
(ICT) equipment. In 2023/24 financial year, the budget will decreases by 39.1 per cent due to completion
of ICT upgrades in the office accommodation.
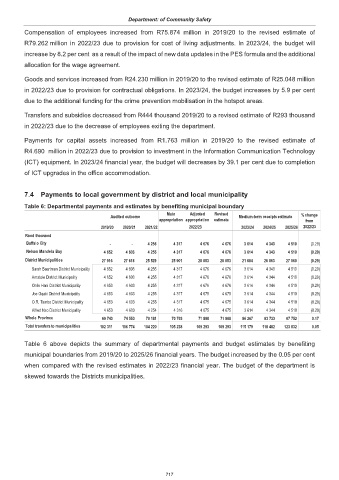
7.4 Payments to local government by district and local municipality
Table 6: Departmental payments and estimates by benefiting municipal boundary
Main Adjusted Revised % change
Audited outcome Medium-term receipts estimate
appropriation appropriation estimate from
2019/20 2020/21 2021/22 2022/23 2023/24 2024/25 2025/26 2022/23
Rand thousand
Buffalo City - - 4 255 4 317 4 676 4 676 3 614 4 343 4 510 (0.29)
Nelson Mandela Bay 4 652 4 603 4 255 4 317 4 676 4 676 3 614 4 343 4 510 (0.29)
District Municipalities 27 916 27 618 25 529 25 901 28 053 28 053 21 684 26 063 27 060 (0.29)
Sarah Baartman District Municipality 4 652 4 603 4 255 4 317 4 676 4 676 3 614 4 343 4 510 (0.29)
Amatole District Municipality 4 652 4 603 4 255 4 317 4 676 4 676 3 614 4 344 4 510 (0.29)
Chris Hani District Municipality 4 653 4 603 4 255 4 317 4 676 4 676 3 614 4 344 4 510 (0.29)
Joe Gqabi District Municipality 4 653 4 603 4 255 4 317 4 675 4 675 3 614 4 344 4 510 (0.29)
O.R. Tambo District Municipality 4 653 4 603 4 255 4 317 4 675 4 675 3 614 4 344 4 510 (0.29)
Alfred Nzo District Municipality 4 653 4 603 4 254 4 316 4 675 4 675 3 614 4 344 4 510 (0.29)
Whole Province 69 743 74 553 70 181 70 703 71 888 71 888 86 267 83 733 87 752 0.17
Total transfers to municipalities 102 311 106 774 104 220 105 238 109 293 109 293 115 179 118 482 123 832 0.05
Table 6 above depicts the summary of departmental payments and budget estimates by benefiting
municipal boundaries from 2019/20 to 2025/26 financial years. The budget increased by the 0.05 per cent
when compared with the revised estimates in 2022/23 financial year. The budget of the department is
skewed towards the Districts municipalities.
717