Page 739 - Provincial Treasury Estimates.pdf
P. 739

Estimates of the Provincial Revenue and Expenditure (EPRE) – 2023/24  Financial Year
           Table 12: Summary of departmental payments and estimates sub-programme: P2 – Provincial Secretariat
           For Police Services
                                                          Main    Adjusted
                                        Outcome                         Revised estimate  Medium-term estimates  % change
                                                        appropriation  appropriation
            R thousand         2019/20  2020/21  2021/22          2022/23          2023/24  2024/25  2025/26  from 2022/23
            1. Programme Support                      8 166                      8 823                      9 984                      9 321                      9 460                      9 460                      8 828                      8 105                      9 005  (6.7)
            2. Policy and Research                      1 986                      2 216                      2 649                      2 713                      2 674                      2 674                      2 436                      3 634                      3 730  (8.9)
            3. Monitoring and Evaluation                      4 253                      5 990                      4 099                      4 173                      3 842                      3 842                      3 093                      3 664                      4 528  (19.5)
            4. Safety Promotion                    32 568                    32 334                    34 039                    34 535                    37 405                    37 405                    36 942                    45 620                    46 551  (1.2)
            5. Community Police Relations                           58                         157                         241                         120                         120                         120                      3 571                      4 046                      4 214  2875.8
            Total payments and estimates                    47 031                    49 520                    51 012                    50 862                    53 501                    53 501                    54 870                    65 069                    68 028  2.6

           Table 13: Summary of departmental payments and estimates by economic classification: P2 – Provincial
           Secretariat For Police Services
                                                                Main   Adjusted
                                             Outcome                          Revised estimate  Medium-term estimates  % change
                                                             appropriation  appropriation
            R thousand               2019/20  2020/21  2021/22          2022/23          2023/24  2024/25  2025/26  from 2022/23
            Current payments                         45 294                    46 701                    48 829                    49 026                    51 631                    51 620                    52 614                    62 683                    65 580  1.9
              Compensation of employees                     32 732                    33 205                    35 306                    35 168                    37 654                    37 643                    39 808                    45 620                    48 654  5.8
              Goods and services                     12 562                    13 496                    13 523                    13 858                    13 977                    13 977                    12 806                    17 063                    16 926  (8.4)
              Interest and rent on land                              –                             –                             –                             –                             –                             –                             –                             –                             –
            Transfers and subsidies to:                           40                         110                           79                             –                           14                           25                             –                             –                             –  (100.0)
              Provinces and municipalities                              –                             –                             –                             –                             –                             –                             –                             –                             –
              Departmental agencies and accounts                             –                             –                             –                             –                             –                             –                             –                             –                             –
              Higher education institutions                             –                             –                             –                             –                             –                             –                             –                             –                             –
              Foreign governments and international organisatio                            –                             –                             –                             –                             –                             –                             –                             –                             –
              Public corporations and private enterprises                             –                             –                             –                             –                             –                             –                             –                             –                             –
              Non-profit institutions                             –                             –                             –                             –                             –                             –                             –                             –                             –
              Households                                    40                         110                           79                             –                           14                           25                             –                             –                             –  (100.0)
            Payments for capital assets                      1 697                      2 659                      2 104                      1 836                      1 856                      1 856                      2 256                      2 386                      2 448  21.6
              Buildings and other fixed structures                             –                             –                             –                             –                             –                             –                             –                             –                             –
              Machinery and equipment                      1 697                      2 659                      2 104                      1 836                      1 856                      1 856                      2 256                      2 386                      2 448  21.6
              Heritage Assets                                 –                             –                             –                             –                             –                             –                             –                             –                             –
              Specialised military assets                             –                             –                             –                             –                             –                             –                             –                             –                             –
              Biological assets                               –                             –                             –                             –                             –                             –                             –                             –                             –
              Land and sub-soil assets                             –                             –                             –                             –                             –                             –                             –                             –                             –
              Software and other intangible assets                             –                             –                             –                             –                             –                             –                             –                             –                             –
            Payments for financial assets                             –                           50                             –                             –                             –                             –                             –                             –                             –
            Total economic classification                    47 031                    49 520                    51 012                    50 862                    53 501                    53 501                    54 870                    65 069                    68 028  2.6

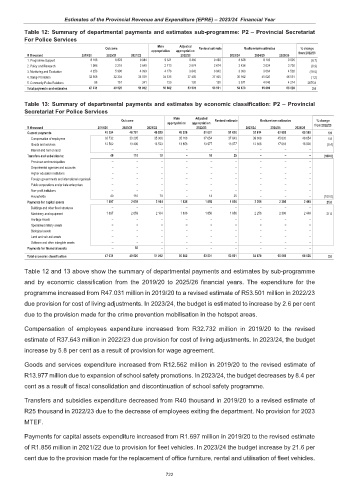
           Table 12 and 13 above show the summary of departmental payments and estimates by sub-programme
           and by economic classification from  the 2019/20 to 2025/26  financial years. The expenditure  for the
           programme increased from R47.031 million in 2019/20 to a revised estimate of R53.501 million in 2022/23

           due provision for cost of living adjustments. In 2023/24, the budget is estimated to increase by 2.6 per cent
           due to the provision made for the crime prevention mobilisation in the hotspot areas.

           Compensation of employees expenditure  increased from R32.732 million in 2019/20 to the  revised

           estimate of R37.643 million in 2022/23 due provision for cost of living adjustments. In 2023/24, the budget
           increase by 5.8 per cent as a result of provision for wage agreement.

           Goods and services expenditure increased from R12.562 million in 2019/20 to the revised estimate of

           R13.977 million due to expansion of school safety promotions. In 2023/24, the budget decreases by 8.4 per
           cent as a result of fiscal consolidation and discontinuation of school safety programme.

           Transfers and subsidies expenditure decreased from R40 thousand in 2019/20 to a revised estimate of
           R25 thousand in 2022/23 due to the decrease of employees exiting the department. No provision for 2023

           MTEF.

           Payments for capital assets expenditure increased from R1.697 million in 2019/20 to the revised estimate
           of R1.856 million in 2021/22 due to provision for fleet vehicles. In 2023/24 the budget increase by 21.6 per

           cent due to the provision made for the replacement of office furniture, rental and utilisation of fleet vehicles.

                                                             722
   734   735   736   737   738   739   740   741   742   743   744