
Page 182 - Demo
P. 182
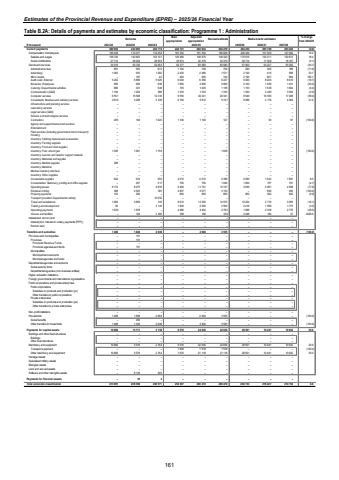
Estimates of the Provincial Revenue and Expenditure (EPRE) %u2013 2025/26 Financial YearTable B.2A: Details of payments and estimates by economic classification: Programme 1 : Administration Outcome Main appropriationAdjusted appropriation Revised estimate Medium-term estimates % change from 2024/25R thousand 2021/22 2022/23 2023/24 2025/26 2026/27 2027/28Current payments 200 954 222 803 224 719 244 731 264 934 264 279 264 232 205 766 203 222 (0.0)Compensation of employees 166 438 172 077 172 056 181 354 181 354 180 699 206 329 151 539 147 920 14.2Salaries and wages 138 726 143 823 143 101 145 480 148 975 148 320 175 615 134 211 129 813 18.4Social contributions 27 712 28 254 28 955 35 874 32 379 32 379 30 714 17 328 18 107 (5.1)Goods and services 34 516 50 726 52 663 63 377 83 580 83 580 57 903 54 227 55 302 (30.7)Administrative fees 953 891 910 1 164 738 704 200 326 188 (71.6)Advertising 970 1 063 1 282 2 430 2 480 1 571 2 100 416 588 33.7Minor assets 197 %u2013 42 450 650 742 2 190 827 864 195.1Audit costs: External 5 896 5 202 5 929 6 000 6 366 6 227 5 000 8 245 8 616 (19.7)Bursaries: Employees 685 609 999 1 800 2 800 2 800 2 100 1 369 1 431 (25.0)Catering: Departmental activities 886 321 548 735 1 045 1 158 1 153 1 538 1 664 (0.4)Communication (G&S) 1 194 1 204 966 1 333 1 333 1 333 1 300 3 439 3 594 (2.5)Computer services 6 551 15 508 12 335 9 550 20 341 20 341 8 549 16 553 17 298 (58.0)Consultants: Business and advisory services 2 810 3 298 3 435 6 150 5 812 5 747 6 986 4 176 4 364 21.6Infrastructure and planning services %u2013 %u2013 %u2013 %u2013 %u2013 %u2013 %u2013 %u2013 %u2013Laboratory services %u2013 %u2013 %u2013 %u2013 %u2013 %u2013 %u2013 %u2013 %u2013Legal services (G&S) %u2013 %u2013 %u2013 %u2013 %u2013 %u2013 %u2013 %u2013 %u2013Science and technological services %u2013 %u2013 %u2013 %u2013 %u2013 %u2013 %u2013 %u2013 %u2013Contractors 285 104 1 020 1 100 1 100 127 %u2013 93 97 (100.0)Agency and support/outsourced services %u2013 %u2013 %u2013 %u2013 %u2013 %u2013 %u2013 %u2013 %u2013Entertainment %u2013 %u2013 %u2013 %u2013 %u2013 %u2013 %u2013 %u2013 %u2013Fleet services (including government motor transport) %u2013 %u2013 %u2013 %u2013 %u2013 %u2013 %u2013 %u2013 %u2013Housing %u2013 %u2013 %u2013 %u2013 %u2013 %u2013 %u2013 %u2013 %u2013Inventory: Clothing material and accessories %u2013 %u2013 %u2013 %u2013 %u2013 %u2013 %u2013 %u2013 %u2013Inventory: Farming supplies %u2013 %u2013 %u2013 %u2013 %u2013 %u2013 %u2013 %u2013 %u2013Inventory: Food and food supplies %u2013 %u2013 %u2013 %u2013 %u2013 %u2013 %u2013 %u2013 %u2013Inventory: Fuel, oil and gas 1 036 1 601 1 759 %u2013 %u2013 1 638 %u2013 %u2013 (100.0) %u2013Inventory: Learner and teacher support material %u2013 %u2013 %u2013 %u2013 %u2013 %u2013 %u2013 %u2013 %u2013Inventory: Materials and supplies %u2013 %u2013 %u2013 %u2013 %u2013 %u2013 %u2013 %u2013 %u2013Inventory: Medical supplies 288 %u2013 %u2013 %u2013 %u2013 %u2013 %u2013 %u2013 %u2013Inventory: Medicine %u2013 %u2013 %u2013 %u2013 %u2013 %u2013 %u2013 %u2013 %u2013Medsas inventory interface %u2013 %u2013 %u2013 %u2013 %u2013 %u2013 %u2013 %u2013 %u2013Inventory: Other supplies %u2013 %u2013 %u2013 %u2013 %u2013 %u2013 %u2013 %u2013 %u2013Consumable supplies 642 619 256 4 072 4 072 2 388 2 590 1 624 1 697 8.5Consumables: Stationery, printing and office supplies %u2013 457 317 750 750 1 049 1 000 757 791 (4.7)Operating leases 8 172 8 275 4 893 9 400 11 701 13 747 3 056 5 861 4 598 (77.8)Rental and hiring 368 2 523 381 2 827 3 077 3 133 %u2013 890 930 (100.0)Property payments 743 290 %u2013 850 850 850 800 602 629 (5.9)Transport provided: Departmental activity %u2013 %u2013 10 652 %u2013 %u2013 %u2013 %u2013 %u2013 %u2013Travel and subsistence 1 969 5 859 316 8 612 13 393 14 575 12 224 2 710 3 365 (16.1)Training and development 92 %u2013 3 140 1 500 2 500 2 500 2 419 1 699 1 775 (3.2)Operating payments 1 639 1 878 %u2013 4 486 4 404 2 782 1 988 2 918 2 776 (28.5)Venues and facilities %u2013 164 3 483 168 168 168 4 248 184 37 2428.6Interest and rent on land %u2013 %u2013 %u2013 %u2013 %u2013 %u2013 %u2013 %u2013 %u2013Interest (Incl. interest on unitary payments (PPP)) %u2013 %u2013 %u2013 %u2013 %u2013 %u2013 %u2013 %u2013 %u2013Rent on land %u2013 %u2013 %u2013 %u2013 %u2013 %u2013 %u2013 %u2013 %u2013Transfers and subsidies 1 468 1 849 2 689 %u2013 2 900 3 555 %u2013 %u2013 (100.0) %u2013Provinces and municipalities %u2013 151 %u2013 %u2013 %u2013 %u2013 %u2013 %u2013 %u2013Provinces %u2013 151 %u2013 %u2013 %u2013 %u2013 %u2013 %u2013 %u2013Provincial Revenue Funds %u2013 %u2013 %u2013 %u2013 %u2013 %u2013 %u2013 %u2013 %u2013Provincial agencies and funds %u2013 151 %u2013 %u2013 %u2013 %u2013 %u2013 %u2013 %u2013Municipalities %u2013 %u2013 %u2013 %u2013 %u2013 %u2013 %u2013 %u2013 %u2013Municipal bank accounts %u2013 %u2013 %u2013 %u2013 %u2013 %u2013 %u2013 %u2013 %u2013Municipal agencies and funds %u2013 %u2013 %u2013 %u2013 %u2013 %u2013 %u2013 %u2013 %u2013Departmental agencies and accounts %u2013 %u2013 %u2013 %u2013 %u2013 %u2013 %u2013 %u2013 %u2013Social security funds %u2013 %u2013 %u2013 %u2013 %u2013 %u2013 %u2013 %u2013 %u2013Departmental agencies (non-business entities) %u2013 %u2013 %u2013 %u2013 %u2013 %u2013 %u2013 %u2013 %u2013Higher education institutions %u2013 %u2013 %u2013 %u2013 %u2013 %u2013 %u2013 %u2013 %u2013Foreign governments and international organisations %u2013 %u2013 %u2013 %u2013 %u2013 %u2013 %u2013 %u2013 %u2013Public corporations and private enterprises %u2013 %u2013 %u2013 %u2013 %u2013 %u2013 %u2013 %u2013 %u2013Public corporations %u2013 %u2013 %u2013 %u2013 %u2013 %u2013 %u2013 %u2013 %u2013Subsidies on products and production (pc) %u2013 %u2013 %u2013 %u2013 %u2013 %u2013 %u2013 %u2013 %u2013Other transfers to public corporations %u2013 %u2013 %u2013 %u2013 %u2013 %u2013 %u2013 %u2013 %u2013Private enterprises %u2013 %u2013 %u2013 %u2013 %u2013 %u2013 %u2013 %u2013 %u2013Subsidies on products and production (pe) %u2013 %u2013 %u2013 %u2013 %u2013 %u2013 %u2013 %u2013 %u2013Other transfers to private enterprises %u2013 %u2013 %u2013 %u2013 %u2013 %u2013 %u2013 %u2013 %u2013Non-profit institutions %u2013 %u2013 %u2013 %u2013 %u2013 %u2013 %u2013 %u2013 %u2013Households 1 468 1 698 2 689 %u2013 2 900 3 555 %u2013 %u2013 (100.0) %u2013Social benefits %u2013 259 %u2013 %u2013 %u2013 %u2013 %u2013 %u2013 %u2013Other transfers to households 1 468 1 439 2 689 %u2013 2 900 3 555 %u2013 %u2013 (100.0) %u2013Payments for capital assets 10 669 13 711 3 159 9 576 22 636 22 636 28 501 10 461 10 932 25.9Buildings and other fixed structures %u2013 %u2013 %u2013 %u2013 %u2013 %u2013 %u2013 %u2013 %u2013Buildings %u2013 %u2013 %u2013 %u2013 %u2013 %u2013 %u2013 %u2013 %u2013Other fixed structures %u2013 %u2013 %u2013 %u2013 %u2013 %u2013 %u2013 %u2013 %u2013Machinery and equipment 10 669 5 576 2 764 9 576 22 636 22 636 28 501 10 461 10 932 25.9Transport equipment %u2013 %u2013 %u2013 1 900 1 518 1 518 %u2013 %u2013 (100.0) %u2013Other machinery and equipment 10 669 5 576 2 764 7 676 21 118 21 118 28 501 10 461 10 932 35.0Heritage Assets %u2013 %u2013 %u2013 %u2013 %u2013 %u2013 %u2013 %u2013 %u2013Specialised military assets %u2013 %u2013 %u2013 %u2013 %u2013 %u2013 %u2013 %u2013 %u2013Biological assets %u2013 %u2013 %u2013 %u2013 %u2013 %u2013 %u2013 %u2013 %u2013Land and sub-soil assets %u2013 %u2013 %u2013 %u2013 %u2013 %u2013 %u2013 %u2013 %u2013Software and other intangible assets %u2013 8 135 395 %u2013 %u2013 %u2013 %u2013 %u2013 %u2013Payments for financial assets %u2013 35 4 %u2013 %u2013 %u2013 %u2013 %u2013 %u2013Total economic classification 213 091 238 398 230 571 254 307 290 470 290 470 292 733 216 227 214 154 0.82024/25 161
