
Page 281 - Demo
P. 281
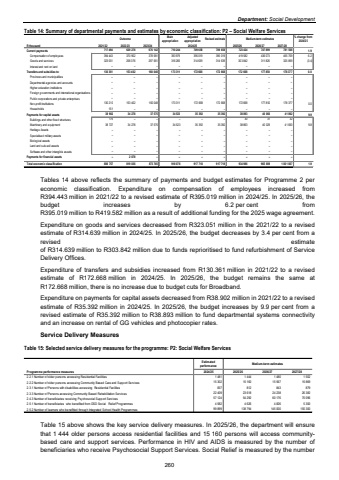
Department: Social DevelopmentTable 14: Summary of departmental payments and estimates by economic classification: P2 %u2013 Social Welfare Services Outcome Main appropriationAdjusted appropriation Revised estimate Medium-term estimates % change from 2024/25R thousand 2021/22 2022/23 2023/24 2025/26 2026/27 2027/28Current payments 629 278 717 494 676 142 710 244 709 658 709 658 723 424 747 899 781 568 1.9Compensation of employees 370 902 394 443 378 581 393 979 395 019 395 019 419 582 436 073 455 709 6.2Goods and services 258 376 323 051 297 561 316 265 314 639 314 639 303 842 311 826 325 859 (3.4)Interest and rent on land %u2013 %u2013 %u2013 %u2013 %u2013 %u2013 %u2013 %u2013 %u2013 Transfers and subsidies to: 153 402 130 361 160 048 173 311 172 668 172 668 172 668 177 850 178 377 0.0Provinces and municipalities %u2013 %u2013 %u2013 %u2013 %u2013 %u2013 %u2013 %u2013 %u2013 Departmental agencies and accounts %u2013 %u2013 %u2013 %u2013 %u2013 %u2013 %u2013 %u2013 %u2013 Higher education institutions %u2013 %u2013 %u2013 %u2013 %u2013 %u2013 %u2013 %u2013 %u2013Foreign governments and international organisations %u2013 %u2013 %u2013 %u2013 %u2013 %u2013 %u2013 %u2013 %u2013Public corporations and private enterprises %u2013 %u2013 %u2013 %u2013 %u2013 %u2013 %u2013 %u2013 %u2013Non-profit institutions 130 210 153 402 160 048 173 311 172 668 172 668 172 668 177 850 178 377 0.0Households 151 %u2013 %u2013 %u2013 %u2013 %u2013 %u2013 %u2013 %u2013Payments for capital assets 38 902 34 278 37 575 34 523 35 392 35 392 38 893 40 060 41 862 9.9Buildings and other fixed structures 175 %u2013 %u2013 %u2013 %u2013 %u2013 30 31 32Machinery and equipment 38 727 34 278 37 575 34 523 35 392 35 392 38 863 40 029 41 830 9.8Heritage Assets %u2013 %u2013 %u2013 %u2013 %u2013 %u2013 %u2013 %u2013 %u2013Specialised military assets %u2013 %u2013 %u2013 %u2013 %u2013 %u2013 %u2013 %u2013 %u2013Biological assets %u2013 %u2013 %u2013 %u2013 %u2013 %u2013 %u2013 %u2013 %u2013Land and sub-soil assets %u2013 %u2013 %u2013 %u2013 %u2013 %u2013 %u2013 %u2013 %u2013Software and other intangible assets %u2013 %u2013 %u2013 %u2013 %u2013 %u2013 %u2013 %u2013 %u2013Payments for financial assets %u2013 2 078 %u2013 %u2013 %u2013 %u2013 %u2013 %u2013 %u2013Total economic classification 886 757 819 036 873 765 918 078 917 718 917 718 934 986 965 809 1 001 807 1.92024/25 Tables 14 above reflects the summary of payments and budget estimates for Programme 2 per economic classification. Expenditure on compensation of employees increased from R394.443 million in 2021/22 to a revised estimate of R395.019 million in 2024/25. In 2025/26, the budget increases by 6.2 per cent from R395.019 million to R419.582 million as a result of additional funding for the 2025 wage agreement. Expenditure on goods and services decreased from R323.051 million in the 2021/22 to a revised estimate of R314.639 million in 2024/25. In 2025/26, the budget decreases by 3.4 per cent from a revised estimate of R314.639 million to R303.842 million due to funds reprioritised to fund refurbishment of Service Delivery Offices. Expenditure of transfers and subsidies increased from R130.361 million in 2021/22 to a revised estimate of R172.668 million in 2024/25. In 2025/26, the budget remains the same at R172.668 million, there is no increase due to budget cuts for Broadband. Expenditure on payments for capital assets decreased from R38.902 million in 2021/22 to a revised estimate of R35.392 million in 2024/25. In 2025/26, the budget increases by 9.9 per cent from a revised estimate of R35.392 million to R38.893 million to fund departmental systems connectivity and an increase on rental of GG vehicles and photocopier rates. Service Delivery Measures Table 15: Selected service delivery measures for the programme: P2: Social Welfare Services Estimatedperformance Medium-term estimatesProgramme performance measures 2024/25 2025/26 2026/27 2027/282.2.1 Number of older persons accessing Residential Facilities 1 444 1 481 1 480 1 502 2.2.2 Number of older persons accessing Community Based Care and Support Services 15 160 15 302 15 567 15 869 2.3.1 Number of Persons with disabilities accessing Residential Facilities 812 837 843 879 2.3.3 Number of Persons accessing Community Based Rehabilitation Services 23 618 24 238 22 409 26 382 2.4.3 Number of beneficiaries receiving Psychosocial Support Services 54 292 60 176 57 124 70 096 2.5.1 Number of beneficiaries who benefited from DSD Social Relief Programmes 4 626 4 582 4 826 5 300 2.5.2 Number of learners who benefitted through Integrated School Health Programmes 138 794 99 899 145 000 150 300 Table 15 above shows the key service delivery measures. In 2025/26, the department will ensure that 1 444 older persons access residential facilities and 15 160 persons will access communitybased care and support services. Performance in HIV and AIDS is measured by the number of beneficiaries who receive Psychosocial Support Services. Social Relief is measured by the number 260
