
Page 295 - Demo
P. 295
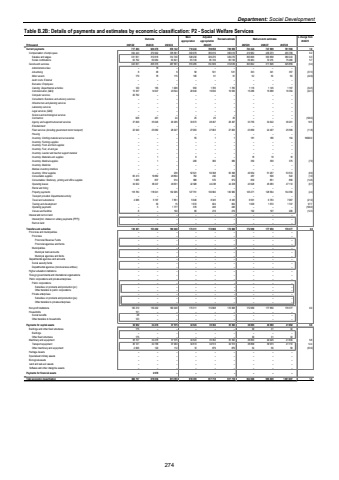
Department: Social DevelopmentTable B.2B: Details of payments and estimates by economic classification: P2 - Social Welfare Services Outcome Main appropriationAdjusted appropriation Revised estimate Medium-term estimates % change from 2024/25R thousand 2021/22 2022/23 2023/24 2025/26 2026/27 2027/28Current payments 629 278 717 494 676 142 710 244 709 658 709 658 723 424 747 899 781 568 1.9Compensation of employees 394 443 370 902 378 581 393 979 395 019 395 019 419 582 436 073 455 709 6.2Salaries and wages 331 651 310 818 314 740 328 230 329 270 329 270 350 098 363 858 380 243 6.3Social contributions 62 792 60 084 63 841 65 749 65 749 65 749 69 484 72 215 75 466 5.7Goods and services 323 051 258 376 297 561 316 265 314 639 314 639 303 842 311 826 325 859 (3.4)Administrative fees %u2013 18 %u2013 %u2013 %u2013 %u2013 %u2013 %u2013 %u2013Advertising 8 38 9 58 531 531 333 341 357 (37.3)Minor assets 179 78 115 106 91 91 52 53 56 (42.9)Audit costs: External %u2013 %u2013 %u2013 %u2013 %u2013 %u2013 %u2013 %u2013 %u2013Bursaries: Employees %u2013 %u2013 %u2013 %u2013 %u2013 %u2013 %u2013 %u2013 %u2013Catering: Departmental activities 120 165 1 009 993 1 705 1 705 1 116 1 145 1 197 (34.5)Communication (G&S) 15 337 14 647 20 544 20 940 19 630 19 630 15 286 15 688 16 394 (22.1)Computer services 20 792 %u2013 %u2013 %u2013 %u2013 %u2013 %u2013 %u2013 %u2013Consultants: Business and advisory services %u2013 %u2013 %u2013 %u2013 %u2013 %u2013 %u2013 %u2013 %u2013Infrastructure and planning services %u2013 %u2013 %u2013 %u2013 %u2013 %u2013 %u2013 %u2013 %u2013Laboratory services %u2013 %u2013 %u2013 %u2013 %u2013 %u2013 %u2013 %u2013 %u2013Legal services (G&S) %u2013 %u2013 %u2013 %u2013 %u2013 %u2013 %u2013 %u2013 %u2013Science and technological services %u2013 %u2013 %u2013 %u2013 %u2013 %u2013 %u2013 %u2013 %u2013Contractors 628 461 24 25 25 25 %u2013 %u2013 %u2013 (100.0)Agency and support/outsourced services 37 849 35 046 29 295 33 673 28 497 28 497 33 755 34 642 36 201 18.5Entertainment %u2013 %u2013 %u2013 %u2013 %u2013 %u2013 %u2013 %u2013 %u2013Fleet services (including government motor transport) 22 940 25 682 28 047 27 063 27 063 27 063 23 869 24 497 25 599 (11.8)Housing %u2013 %u2013 %u2013 %u2013 %u2013 %u2013 %u2013 %u2013 %u2013Inventory: Clothing material and accessories %u2013 %u2013 %u2013 55 1 1 181 186 194 18000.0Inventory: Farming supplies %u2013 %u2013 %u2013 %u2013 %u2013 %u2013 %u2013 %u2013 %u2013Inventory: Food and food supplies %u2013 %u2013 %u2013 %u2013 %u2013 %u2013 %u2013 %u2013 %u2013Inventory: Fuel, oil and gas %u2013 %u2013 %u2013 %u2013 %u2013 %u2013 %u2013 %u2013 %u2013Inventory: Learner and teacher support material %u2013 %u2013 %u2013 %u2013 %u2013 %u2013 %u2013 %u2013 %u2013Inventory: Materials and supplies %u2013 1 %u2013 8 %u2013 %u2013 18 18 18Inventory: Medical supplies %u2013 1 %u2013 280 380 380 350 359 375 (7.9)Inventory: Medicine %u2013 %u2013 %u2013 %u2013 %u2013 %u2013 %u2013 %u2013 %u2013Medsas inventory interface %u2013 %u2013 %u2013 %u2013 %u2013 %u2013 %u2013 %u2013 %u2013Inventory: Other supplies %u2013 %u2013 239 52 521 50 398 50 398 49 954 51 267 53 574 (0.9)Consumable supplies 66 413 19 882 28 894 762 492 492 487 500 522 (1.0)Consumables: Stationery, printing and office supplies 1 285 837 914 988 972 972 830 851 890 (14.6)Operating leases 34 622 38 247 46 631 42 928 44 238 44 238 43 928 45 083 47 112 (0.7)Rental and hiring %u2013 %u2013 %u2013 %u2013 %u2013 %u2013 %u2013 %u2013 %u2013Property payments 118 784 118 041 132 005 127 791 130 982 130 982 125 271 128 564 134 350 (4.4)Transport provided: Departmental activity %u2013 %u2013 %u2013 %u2013 %u2013 %u2013 %u2013 %u2013 %u2013Travel and subsistence 4 086 5 197 7 851 5 946 8 345 8 345 6 591 6 763 7 067 (21.0)Training and development %u2013 30 15 1 672 824 824 1 629 1 672 1 747 97.7Operating payments %u2013 5 1 777 376 246 246 %u2013 %u2013 %u2013 (100.0)Venues and facilities 8 %u2013 192 80 219 219 192 197 206 (12.3)Interest and rent on land %u2013 %u2013 %u2013 %u2013 %u2013 %u2013 %u2013 %u2013 %u2013Interest (Incl. interest on unitary payments (PPP)) %u2013 %u2013 %u2013 %u2013 %u2013 %u2013 %u2013 %u2013 %u2013Rent on land %u2013 %u2013 %u2013 %u2013 %u2013 %u2013 %u2013 %u2013 %u2013Transfers and subsidies 130 361 153 402 160 048 173 311 172 668 172 668 172 669 177 850 178 377 0.0 Provinces and municipalities %u2013 %u2013 %u2013 %u2013 %u2013 %u2013 %u2013 %u2013 %u2013Provinces %u2013 %u2013 %u2013 %u2013 %u2013 %u2013 %u2013 %u2013 %u2013Provincial Revenue Funds %u2013 %u2013 %u2013 %u2013 %u2013 %u2013 %u2013 %u2013 %u2013Provincial agencies and funds %u2013 %u2013 %u2013 %u2013 %u2013 %u2013 %u2013 %u2013 %u2013Municipalities %u2013 %u2013 %u2013 %u2013 %u2013 %u2013 %u2013 %u2013 %u2013Municipal bank accounts %u2013 %u2013 %u2013 %u2013 %u2013 %u2013 %u2013 %u2013 %u2013Municipal agencies and funds %u2013 %u2013 %u2013 %u2013 %u2013 %u2013 %u2013 %u2013 %u2013Departmental agencies and accounts %u2013 %u2013 %u2013 %u2013 %u2013 %u2013 %u2013 %u2013 %u2013Social security funds %u2013 %u2013 %u2013 %u2013 %u2013 %u2013 %u2013 %u2013 %u2013Departmental agencies (non-business entities) %u2013 %u2013 %u2013 %u2013 %u2013 %u2013 %u2013 %u2013 %u2013Higher education institutions %u2013 %u2013 %u2013 %u2013 %u2013 %u2013 %u2013 %u2013 %u2013Foreign governments and international organisations %u2013 %u2013 %u2013 %u2013 %u2013 %u2013 %u2013 %u2013 %u2013Public corporations and private enterprises %u2013 %u2013 %u2013 %u2013 %u2013 %u2013 %u2013 %u2013 %u2013Public corporations %u2013 %u2013 %u2013 %u2013 %u2013 %u2013 %u2013 %u2013 %u2013Subsidies on products and production (pc) %u2013 %u2013 %u2013 %u2013 %u2013 %u2013 %u2013 %u2013 %u2013Other transfers to public corporations %u2013 %u2013 %u2013 %u2013 %u2013 %u2013 %u2013 %u2013 %u2013Private enterprises %u2013 %u2013 %u2013 %u2013 %u2013 %u2013 %u2013 %u2013 %u2013Subsidies on products and production (pe) %u2013 %u2013 %u2013 %u2013 %u2013 %u2013 %u2013 %u2013 %u2013Other transfers to private enterprises %u2013 %u2013 %u2013 %u2013 %u2013 %u2013 %u2013 %u2013 %u2013Non-profit institutions 130 210 153 402 160 048 173 311 172 668 172 668 172 669 177 850 178 377 0.0Households 151 %u2013 %u2013 %u2013 %u2013 %u2013 %u2013 %u2013 %u2013Social benefits 28 %u2013 %u2013 %u2013 %u2013 %u2013 %u2013 %u2013 %u2013Other transfers to households 123 %u2013 %u2013 %u2013 %u2013 %u2013 %u2013 %u2013 %u2013Payments for capital assets 38 902 34 278 37 575 34 523 35 392 35 392 38 893 40 060 41 862 9.9Buildings and other fixed structures 175 %u2013 %u2013 %u2013 %u2013 %u2013 30 31 32Buildings %u2013 %u2013 %u2013 %u2013 %u2013 %u2013 %u2013 %u2013 %u2013Other fixed structures 175 %u2013 %u2013 %u2013 %u2013 %u2013 30 31 32Machinery and equipment 38 727 34 278 37 575 34 523 35 392 35 392 38 863 40 029 41 830 9.8Transport equipment 36 121 34 158 37 463 34 513 34 513 34 513 38 809 39 973 41 772 12.4Other machinery and equipment 2 606 120 112 10 879 879 54 56 58 (93.9)Heritage Assets %u2013 %u2013 %u2013 %u2013 %u2013 %u2013 %u2013 %u2013 %u2013Specialised military assets %u2013 %u2013 %u2013 %u2013 %u2013 %u2013 %u2013 %u2013 %u2013Biological assets %u2013 %u2013 %u2013 %u2013 %u2013 %u2013 %u2013 %u2013 %u2013Land and sub-soil assets %u2013 %u2013 %u2013 %u2013 %u2013 %u2013 %u2013 %u2013 %u2013Software and other intangible assets %u2013 %u2013 %u2013 %u2013 %u2013 %u2013 %u2013 %u2013 %u2013Payments for financial assets %u2013 2 078 %u2013 %u2013 %u2013 %u2013 %u2013 %u2013 %u2013Total economic classification 886 757 819 036 873 765 918 078 917 718 917 718 934 986 965 809 1 001 807 1.92024/25274
