
Page 292 - Demo
P. 292
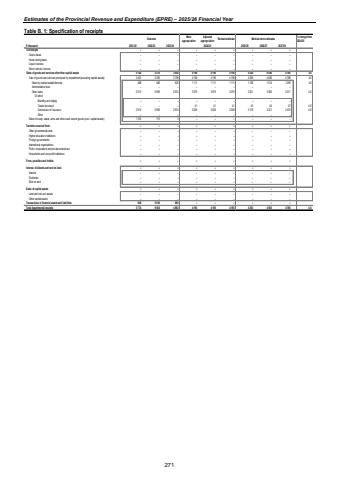
Estimates of the Provincial Revenue and Expenditure (EPRE) %u2013 2025/26 Financial YearTable B. 1: Specification of receipts Outcome Main appropriationAdjusted appropriation Revised estimate Medium-term estimates % change from 2024/25R thousand 2021/22 2022/23 2023/24 2025/26 2026/27 2027/28Tax receipts %u2013 %u2013 %u2013 %u2013 %u2013 %u2013 %u2013 %u2013 %u2013 Casino taxes %u2013 %u2013 %u2013 %u2013 %u2013 %u2013 %u2013 %u2013 %u2013 Horse racing taxes %u2013 %u2013 %u2013 %u2013 %u2013 %u2013 %u2013 %u2013 %u2013 Liquor licences %u2013 %u2013 %u2013 %u2013 %u2013 %u2013 %u2013 %u2013 %u2013 Motor vehicle licences %u2013 %u2013 %u2013 %u2013 %u2013 %u2013 %u2013 %u2013 %u2013 Sales of goods and services other than capital assets 5 126 3 570 3 802 4 190 4 190 4 190 4 383 4 580 4 786 4.6Sale of goods and services produced by department (excluding capital assets) 3 401 3 395 3 799 4 190 4 190 4 190 4 383 4 580 4 786 4.6Sales by market establishments 488 486 825 1 111 1 111 1 111 1 162 1 214 1 269 4.6Administrative fees %u2013 %u2013 %u2013 %u2013 %u2013 %u2013 %u2013 %u2013 %u2013Other sales 2 913 2 909 2 974 3 079 3 079 3 079 3 221 3 366 3 517 4.6Of whichBoarding and lodging %u2013 %u2013 %u2013 %u2013 %u2013 %u2013 %u2013 %u2013 %u2013Tender document %u2013 %u2013 %u2013 41 41 41 43 45 47 4.9Commission of insurance 2 913 2 909 2 974 3 038 3 038 3 038 3 178 3 321 3 470 4.6Other %u2013 %u2013 %u2013 %u2013 %u2013 %u2013 %u2013 %u2013 %u2013Sales of scrap, waste, arms and other used current goods (excl. capital assets) 1 725 175 3 %u2013 %u2013 %u2013 %u2013 %u2013 %u2013Transfers received from: %u2013 %u2013 %u2013 %u2013 %u2013 %u2013 %u2013 %u2013 %u2013Other governmental units %u2013 %u2013 %u2013 %u2013 %u2013 %u2013 %u2013 %u2013 %u2013Higher education institutions %u2013 %u2013 %u2013 %u2013 %u2013 %u2013 %u2013 %u2013 %u2013Foreign governments %u2013 %u2013 %u2013 %u2013 %u2013 %u2013 %u2013 %u2013 %u2013International organisations %u2013 %u2013 %u2013 %u2013 %u2013 %u2013 %u2013 %u2013 %u2013Public corporations and private enterprises %u2013 %u2013 %u2013 %u2013 %u2013 %u2013 %u2013 %u2013 %u2013Households and non-profit institutions %u2013 %u2013 %u2013 %u2013 %u2013 %u2013 %u2013 %u2013 %u2013Fines, penalties and forfeits %u2013 %u2013 %u2013 %u2013 %u2013 %u2013 %u2013 %u2013 %u2013Interest, dividends and rent on land %u2013 %u2013 %u2013 %u2013 %u2013 %u2013 %u2013 %u2013 %u2013Interest %u2013 %u2013 %u2013 %u2013 %u2013 %u2013 %u2013 %u2013 %u2013Dividends %u2013 %u2013 %u2013 %u2013 %u2013 %u2013 %u2013 %u2013 %u2013Rent on land %u2013 %u2013 %u2013 %u2013 %u2013 %u2013 %u2013 %u2013 %u2013Sales of capital assets %u2013 %u2013 %u2013 %u2013 %u2013 %u2013 %u2013 %u2013 %u2013Land and sub-soil assets %u2013 %u2013 %u2013 %u2013 %u2013 %u2013 %u2013 %u2013 %u2013Other capital assets %u2013 %u2013 %u2013 %u2013 %u2013 %u2013 %u2013 %u2013 %u2013Transactions in financial assets and liabilities 648 5 938 890 %u2013 %u2013 %u2013 %u2013 %u2013 %u2013Total departmental receipts 5 774 9 508 4 692 4 190 4 190 4 190 4 383 4 580 4 786 4.62024/25271
