
Page 289 - Demo
P. 289
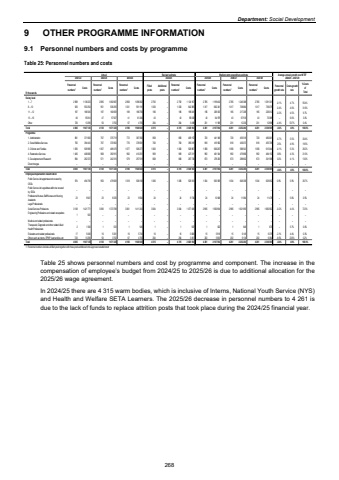
Department: Social Development9 OTHER PROGRAMME INFORMATION 9.1 Personnel numbers and costs by programme Table 25: Personnel numbers and costs Actual Revised estimate Medium-term expenditure estimateR thousandsPersonnel numbers1 Costs Personnel numbers1 Costs Personnel numbers1 Costs Filled postsAdditional postsPersonnel numbers1 Costs Personnel numbers1 Costs Personnel numbers1 Costs Personnel numbers1 Costs Personnel growth rate Costs growth rate % Costs of Total Salary level1 %u2013 7 2 969 1 138 223 2 895 1 092 687 2 858 1 096 062 2 792 %u2013 2 792 1 124 167 2 785 1 199 402 2 785 1 246 386 2 785 1 291 331 -0.1% 4.7% 55.4%8 %u2013 10 923 553 254 951 536 293 1 031 591 191 1 030 %u2013 1 030 642 365 1 017 682 241 1 017 708 864 1 017 736 075 -0.4% 4.6% 31.6%11 %u2013 12 187 186 545 187 180 659 189 186 756 186 %u2013 186 198 041 185 209 033 185 217 206 185 226 012 -0.2% 4.5% 9.7%13 %u2013 16 46 55 814 47 57 927 41 61 246 43 %u2013 43 58 033 43 64 979 43 67 518 43 70 389 %u2013 6.6% 3.0%Other 720 13 290 50 3 762 67 4 765 264 %u2013 264 3 498 231 11 909 231 12 230 231 12 698 -4.4% 53.7% 0.4%Total 4 845 1 947 126 4 130 1 871 328 4 186 1 940 020 4 315 %u2013 4 315 2 026 104 4 261 2 167 564 4 261 2 252 204 4 261 2 336 505 -0.4% 4.9% 100.0%Programme1. Administration 861 371 660 767 375 719 772 387 392 858 %u2013 858 409 157 720 441 948 720 459 318 720 480 001 -5.7% 5.5% 20.4%2. Social Welfare Services 792 394 443 767 370 902 776 378 581 760 %u2013 760 395 019 818 419 582 818 436 073 818 455 709 2.5% 4.9% 19.5%3. Children and Families 1 093 509 985 1 057 489 476 1 077 506 277 1 060 %u2013 1 060 526 987 1 058 566 287 1 058 588 543 1 058 615 044 -0.1% 5.3% 26.2%4. Restorative Services 1 405 408 666 968 392 915 982 410 251 969 %u2013 969 427 211 992 461 544 992 479 668 992 484 153 0.8% 4.3% 21.0%5. Development and Research 694 262 372 571 242 316 579 257 519 668 %u2013 668 267 730 673 278 203 673 288 602 673 301 598 0.2% 4.1% 13.0%Direct charges %u2013 %u2013 %u2013 %u2013 %u2013 %u2013 %u2013 %u2013 %u2013 %u2013 %u2013 %u2013 %u2013 %u2013 %u2013 %u2013 %u2013 %u2013 %u2013Total 4 845 1 947 126 4 130 1 871 328 4 186 1 940 020 4 315 %u2013 4 315 2 026 104 4 261 2 167 564 4 261 2 252 204 4 261 2 336 505 -0.4% 4.9% 100.0%Employee dispensation classificationPublic Service Act appointees not covered by OSDs 974 494 790 950 479 609 1 018 508 168 1 006 %u2013 1 006 529 310 1 034 583 569 1 034 606 356 1 034 629 052 0.9% 5.9% 26.7%Public Service Act appointees still to be covered by OSDs %u2013 %u2013 %u2013 %u2013 %u2013 %u2013 %u2013 %u2013 %u2013 %u2013 %u2013 %u2013 %u2013 %u2013 %u2013 %u2013 %u2013 %u2013 %u2013Professional Nurses, Staff Nurses and Nursing Assistants 23 9 647 23 8 335 23 9 564 24 %u2013 24 9 734 24 10 648 24 11 064 24 11 478 %u2013 5.6% 0.5%Legal Professionals %u2013 %u2013 %u2013 %u2013 %u2013 %u2013 %u2013 %u2013 %u2013 %u2013 %u2013 %u2013 %u2013 %u2013 %u2013 %u2013 %u2013 %u2013 %u2013Social Services Professions 3 108 1 421 771 3 090 1 373 788 3 061 1 411 243 3 004 %u2013 3 004 1 477 436 2 985 1 560 904 2 985 1 621 855 2 985 1 682 562 -0.2% 4.4% 72.3%Engineering Professions and related occupations 1 922 %u2013 %u2013 %u2013 %u2013 %u2013 %u2013 %u2013 %u2013 %u2013 %u2013 %u2013 %u2013 %u2013 %u2013 %u2013 %u2013 %u2013Medical and related professionals %u2013 %u2013 %u2013 %u2013 %u2013 %u2013 %u2013 %u2013 %u2013 %u2013 %u2013 %u2013 %u2013 %u2013 %u2013 %u2013 %u2013 %u2013 %u2013Therapeutic, Diagnostic and other related Allied Health Professionals 2 1 300 1 533 1 546 1 %u2013 1 567 1 622 1 646 1 670 %u2013 5.7% 0.0%Educators and related professionals 17 5 406 16 5 301 16 5 734 16 %u2013 16 5 606 15 5 918 15 6 149 15 6 379 -2.1% 4.4% 0.3%Others such as interns, EPWP, learnerships, etc 720 13 290 50 3 762 67 4 765 264 %u2013 264 3 451 202 5 903 202 6 134 202 6 364 -8.5% 22.6% 0.2%Total 4 845 1 947 126 4 130 1 871 328 4 186 1 940 020 4 315 %u2013 4 315 2 026 104 4 261 2 167 564 4 261 2 252 204 4 261 2 336 505 -0.4% 4.9% 100.0%1. Personnel numbers includes all filled posts together with those posts additional to the approved establishment Average annual growth over MTEF 2021/22 2022/23 2023/24 2024/25 2025/26 2026/27 2027/28 2024/25 - 2027/28Table 25 shows personnel numbers and cost by programme and component. The increase in the compensation of employee%u2019s budget from 2024/25 to 2025/26 is due to additional allocation for the 2025/26 wage agreement. In 2024/25 there are 4 315 warm bodies, which is inclusive of Interns, National Youth Service (NYS) and Health and Welfare SETA Learners. The 2025/26 decrease in personnel numbers to 4 261 is due to the lack of funds to replace attrition posts that took place during the 2024/25 financial year. 268
