
Page 293 - Demo
P. 293
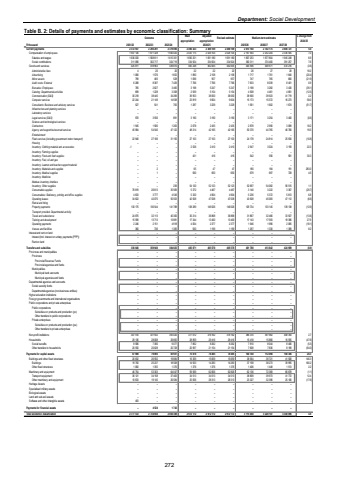
Department: Social DevelopmentTable B. 2: Details of payments and estimates by economic classification: Summary Outcome Main appropriationAdjusted appropriation Revised estimate Medium-term estimates % change from 2024/25R thousand 2021/22 2022/23 2023/24 2025/26 2026/27 2027/28Current payments 2 290 291 2 372 937 2 379 890 2 490 423 2 488 109 2 488 109 2 613 160 2 702 175 2 806 721 5.0Compensation of employees 1 947 126 1 871 328 1 940 020 2 025 175 2 026 104 2 026 104 2 167 564 2 252 204 2 336 505 7.0Salaries and wages 1 636 030 1 568 611 1 615 301 1 690 251 1 691 180 1 691 180 1 807 253 1 877 804 1 945 248 6.9Social contributions 311 096 302 717 324 719 334 924 334 924 334 924 360 311 374 400 391 257 7.6Goods and services 425 811 418 963 439 870 465 248 462 005 462 005 445 596 449 971 470 216 (3.6)Administrative fees 20 4 20 22 22 22 26 27 28 18.2Advertising 1 576 1 080 1 652 1 890 2 158 2 158 1 717 1 761 1 840 (20.4)Minor assets 483 799 528 1 096 957 957 747 765 800 (21.9)Audit costs: External 8 387 6 288 7 429 7 766 7 766 7 766 7 833 8 039 8 401 0.9Bursaries: Employees 785 2 627 3 465 3 198 5 247 5 247 3 198 3 282 3 430 (39.1)Catering: Departmental activities 699 1 228 3 308 2 939 5 154 5 154 4 508 4 461 4 661 (12.5)Communication (G&S) 30 218 38 445 34 269 39 953 38 050 38 050 38 900 39 923 41 719 2.2Computer services 22 244 21 149 14 938 23 819 9 604 9 604 15 173 15 572 16 273 58.0Consultants: Business and advisory services 527 541 705 1 287 3 229 3 229 1 561 1 602 1 674 (51.7)Infrastructure and planning services %u2013 %u2013 %u2013 %u2013 %u2013 %u2013 %u2013 %u2013 %u2013Laboratory services %u2013 %u2013 %u2013 %u2013 %u2013 %u2013 %u2013 %u2013 %u2013Legal services (G&S) 970 3 556 891 3 190 3 190 3 190 3 171 3 254 3 400 (0.6)Science and technological services %u2013 %u2013 %u2013 %u2013 %u2013 %u2013 %u2013 %u2013 %u2013Contractors 1 945 1 580 1 263 2 678 2 435 2 435 2 878 2 956 3 089 18.2Agency and support/outsourced services 45 984 54 540 47 122 48 214 42 165 42 165 50 370 44 765 46 780 19.5Entertainment %u2013 %u2013 %u2013 %u2013 %u2013 %u2013 %u2013 %u2013 %u2013Fleet services (including government motor transport) 22 940 27 106 31 150 27 103 27 103 27 103 24 178 24 814 25 930 (10.8)Housing %u2013 %u2013 %u2013 %u2013 %u2013 %u2013 %u2013 %u2013 %u2013Inventory: Clothing material and accessories -1 %u2013 %u2013 2 526 2 410 2 410 2 947 3 024 3 159 22.3Inventory: Farming supplies %u2013 %u2013 %u2013 %u2013 %u2013 %u2013 %u2013 %u2013 %u2013Inventory: Food and food supplies %u2013 %u2013 %u2013 421 416 416 542 556 581 30.3Inventory: Fuel, oil and gas %u2013 %u2013 %u2013 %u2013 %u2013 %u2013 %u2013 %u2013 %u2013Inventory: Learner and teacher support material %u2013 %u2013 %u2013 %u2013 %u2013 %u2013 %u2013 %u2013 %u2013Inventory: Materials and supplies %u2013 2 %u2013 65 47 47 180 184 191 283.0Inventory: Medical supplies %u2013 1 %u2013 560 650 650 679 697 728 4.5Inventory: Medicine %u2013 %u2013 %u2013 %u2013 %u2013 %u2013 %u2013 %u2013 %u2013Medsas inventory interface %u2013 %u2013 %u2013 %u2013 %u2013 %u2013 %u2013 %u2013 %u2013Inventory: Other supplies %u2013 %u2013 239 54 120 52 123 52 123 52 697 54 082 56 515 1.1Consumable supplies 78 819 26 613 35 569 5 372 4 467 4 467 3 140 3 222 3 367 (29.7)Consumables: Stationery, printing and office supplies 4 633 3 777 4 549 5 320 4 904 4 904 5 236 5 372 5 613 6.8Operating leases 34 622 42 075 50 503 42 928 47 038 47 038 43 928 45 083 47 112 (6.6)Rental and hiring %u2013 %u2013 %u2013 %u2013 %u2013 %u2013 %u2013 %u2013 %u2013Property payments 130 175 136 544 141 788 138 289 149 026 149 026 129 734 133 145 139 138 (12.9)Transport provided: Departmental activity %u2013 %u2013 %u2013 %u2013 %u2013 %u2013 %u2013 %u2013 %u2013Travel and subsistence 24 875 32 113 40 300 30 214 36 868 36 868 31 867 32 466 33 927 (13.6)Training and development 15 599 13 713 13 881 17 344 13 400 13 400 17 143 17 593 18 386 27.9Operating payments 2 246 2 151 4 918 4 004 2 377 2 377 1 946 1 996 2 085 (18.1)Venues and facilities 360 736 1 383 930 1 199 1 199 1 297 1 330 1 389 8.2Interest and rent on land %u2013 %u2013 %u2013 %u2013 %u2013 %u2013 %u2013 %u2013 %u2013Interest (Incl. interest on unitary payments (PPP)) %u2013 %u2013 %u2013 %u2013 %u2013 %u2013 %u2013 %u2013 %u2013Rent on land %u2013 %u2013 %u2013 %u2013 %u2013 %u2013 %u2013 %u2013 %u2013Transfers and subsidies 336 646 359 940 384 825 405 871 405 578 405 578 401 788 413 842 424 989 (0.9)Provinces and municipalities %u2013 %u2013 %u2013 %u2013 %u2013 %u2013 %u2013 %u2013 %u2013Provinces %u2013 %u2013 %u2013 %u2013 %u2013 %u2013 %u2013 %u2013 %u2013Provincial Revenue Funds %u2013 %u2013 %u2013 %u2013 %u2013 %u2013 %u2013 %u2013 %u2013Provincial agencies and funds %u2013 %u2013 %u2013 %u2013 %u2013 %u2013 %u2013 %u2013 %u2013Municipalities %u2013 %u2013 %u2013 %u2013 %u2013 %u2013 %u2013 %u2013 %u2013Municipal bank accounts %u2013 %u2013 %u2013 %u2013 %u2013 %u2013 %u2013 %u2013 %u2013Municipal agencies and funds %u2013 %u2013 %u2013 %u2013 %u2013 %u2013 %u2013 %u2013 %u2013Departmental agencies and accounts %u2013 %u2013 %u2013 %u2013 %u2013 %u2013 %u2013 %u2013 %u2013Social security funds %u2013 %u2013 %u2013 %u2013 %u2013 %u2013 %u2013 %u2013 %u2013Departmental agencies (non-business entities) %u2013 %u2013 %u2013 %u2013 %u2013 %u2013 %u2013 %u2013 %u2013Higher education institutions %u2013 %u2013 %u2013 %u2013 %u2013 %u2013 %u2013 %u2013 %u2013Foreign governments and international organisations %u2013 %u2013 %u2013 %u2013 %u2013 %u2013 %u2013 %u2013 %u2013Public corporations and private enterprises %u2013 %u2013 %u2013 %u2013 %u2013 %u2013 %u2013 %u2013 %u2013Public corporations %u2013 %u2013 %u2013 %u2013 %u2013 %u2013 %u2013 %u2013 %u2013Subsidies on products and production (pc) %u2013 %u2013 %u2013 %u2013 %u2013 %u2013 %u2013 %u2013 %u2013Other transfers to public corporations %u2013 %u2013 %u2013 %u2013 %u2013 %u2013 %u2013 %u2013 %u2013Private enterprises %u2013 %u2013 %u2013 %u2013 %u2013 %u2013 %u2013 %u2013 %u2013Subsidies on products and production (pe) %u2013 %u2013 %u2013 %u2013 %u2013 %u2013 %u2013 %u2013 %u2013Other transfers to private enterprises %u2013 %u2013 %u2013 %u2013 %u2013 %u2013 %u2013 %u2013 %u2013Non-profit institutions 307 510 331 932 355 020 377 012 376 162 376 162 386 370 397 962 408 394 2.7Households 29 136 28 008 29 805 28 859 29 416 29 416 15 418 15 880 16 595 (47.6)Social benefits 8 586 7 380 9 077 7 862 8 262 8 262 7 810 8 044 8 406 (5.5)Other transfers to households 20 550 20 628 20 728 20 997 21 154 21 154 7 608 7 836 8 189 (64.0)Payments for capital assets 67 989 79 895 83 931 75 878 78 485 78 485 100 700 112 090 108 386 28.3Buildings and other fixed structures 20 832 26 592 19 884 16 309 15 659 15 659 38 564 39 721 41 508 146.3Buildings 19 750 25 237 18 508 14 933 14 283 14 283 37 158 38 273 39 995 160.2Other fixed structures 1 082 1 355 1 376 1 376 1 376 1 376 1 406 1 448 1 513 2.2Machinery and equipment 46 754 53 303 64 047 59 569 62 826 62 826 62 136 72 369 66 878 (1.1)Transport equipment 36 121 34 158 37 463 34 513 34 513 34 513 38 809 39 973 41 772 12.4Other machinery and equipment 10 633 19 145 26 584 25 056 28 313 28 313 23 327 32 396 25 106 (17.6)Heritage Assets %u2013 %u2013 %u2013 %u2013 %u2013 %u2013 %u2013 %u2013 %u2013Specialised military assets %u2013 %u2013 %u2013 %u2013 %u2013 %u2013 %u2013 %u2013 %u2013Biological assets %u2013 %u2013 %u2013 %u2013 %u2013 %u2013 %u2013 %u2013 %u2013Land and sub-soil assets %u2013 %u2013 %u2013 %u2013 %u2013 %u2013 %u2013 %u2013 %u2013Software and other intangible assets 403 %u2013 %u2013 %u2013 %u2013 %u2013 %u2013 %u2013 %u2013Payments for financial assets %u2013 4 524 1 742 %u2013 %u2013 %u2013 %u2013 %u2013 %u2013Total economic classification 2 777 572 2 734 650 2 850 388 2 972 172 2 972 172 2 972 172 3 115 648 3 228 107 3 340 096 4.82024/25272
