
Page 322 - Demo
P. 322
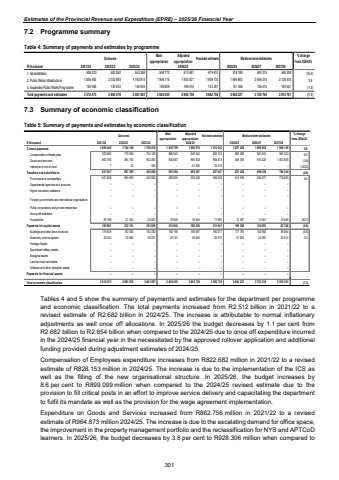
Estimates of the Provincial Revenue and Expenditure (EPRE) %u2013 2025/26 Financial Year7.2 Programme summary Table 4: Summary of payments and estimates by programme Outcome Main appropriationAdjusted appropriation Revised estimate Medium-term estimates % change from 2024/25R thousand 2021/22 2022/23 2023/24 2025/26 2026/27 2027/281. Administration 500 062 506 023 552 369 558 770 613 697 619 610 518 189 540 315 546 208 (16.4)2. Public Works Infrastructure 2 032 883 1 855 492 1 763 814 1 906 176 1 900 021 1 909 735 1 984 683 2 046 014 2 128 416 3.93. Expanded Public Works Programme 130 633 150 958 144 904 159 609 169 018 153 391 151 356 136 415 140 557 (1.3)Total payments and estimates 2 663 578 2 512 473 2 461 087 2 624 555 2 682 736 2 682 736 2 654 227 2 722 744 2 815 181 (1.1)2024/257.3 Summary of economic classification Table 5: Summary of payments and estimates by economic classification Outcome Main appropriationAdjusted appropriation Revised estimate Medium-term estimates % change from 2024/25R thousand 2021/22 2022/23 2023/24 2025/26 2026/27 2027/28Current payments 1 764 158 1 685 445 1 708 010 1 816 709 1 896 970 1 813 542 1 827 405 1 898 853 1 968 129 0.8Compensation of employees 779 380 822 682 755 128 886 042 849 042 828 153 899 099 923 433 965 323 8.6Goods and services 984 755 862 756 952 283 930 667 990 928 964 873 928 306 975 420 1 002 806 (3.8)Interest and rent on land 23 7 599 %u2013 57 000 20 516 %u2013 %u2013 %u2013 (100.0)Transfers and subsidies to: 687 299 631 047 560 058 591 904 596 507 657 547 627 426 698 338 784 344 (4.6)Provinces and municipalities 665 995 601 859 540 005 580 955 585 558 585 558 614 939 685 277 770 695 5.0Departmental agencies and accounts %u2013 %u2013 %u2013 %u2013 %u2013 %u2013 %u2013 %u2013 %u2013 Higher education institutions %u2013 %u2013 %u2013 %u2013 %u2013 %u2013 %u2013 %u2013 %u2013Foreign governments and international organisations %u2013 %u2013 %u2013 %u2013 %u2013 %u2013 %u2013 %u2013 %u2013Public corporations and private enterprises %u2013 %u2013 %u2013 %u2013 %u2013 %u2013 %u2013 %u2013 %u2013Non-profit institutions %u2013 %u2013 %u2013 %u2013 %u2013 %u2013 %u2013 %u2013 %u2013Households 29 188 21 304 20 053 10 949 10 949 71 989 12 487 13 061 13 649 (82.7)Payments for capital assets 195 981 212 121 193 019 215 942 189 259 211 647 199 396 125 553 62 708 (5.8)Buildings and other fixed structures 175 639 192 036 164 782 193 195 159 697 190 677 177 793 102 956 39 094 (6.8)Machinery and equipment 20 342 20 085 28 237 22 747 29 562 20 970 21 603 22 597 23 614 3.0Heritage Assets %u2013 %u2013 %u2013 %u2013 %u2013 %u2013 %u2013 %u2013 %u2013Specialised military assets %u2013 %u2013 %u2013 %u2013 %u2013 %u2013 %u2013 %u2013 %u2013Biological assets %u2013 %u2013 %u2013 %u2013 %u2013 %u2013 %u2013 %u2013 %u2013Land and sub-soil assets %u2013 %u2013 %u2013 %u2013 %u2013 %u2013 %u2013 %u2013 %u2013Software and other intangible assets %u2013 %u2013 %u2013 %u2013 %u2013 %u2013 %u2013 %u2013 %u2013Payments for financial assets %u2013 %u2013 %u2013 %u2013 %u2013 %u2013 %u2013 %u2013 %u2013Total economic classification 2 512 473 2 663 578 2 461 087 2 624 555 2 682 736 2 682 736 2 654 227 2 722 744 2 815 181 (1.1)2024/25 Tables 4 and 5 show the summary of payments and estimates for the department per programme and economic classification. The total payments increased from R2.512 billion in 2021/22 to a revised estimate of R2.682 billion in 2024/25. The increase is attributable to normal inflationary adjustments as well once off allocations. In 2025/26 the budget decreases by 1.1 per cent from R2.682 billion to R2.654 billion when compared to the 2024/25 due to once off expenditure incurred in the 2024/25 financial year in the necessitated by the approved rollover application and additional funding provided during adjustment estimates of 2024/25. Compensation of Employees expenditure increases from R822.682 million in 2021/22 to a revised estimate of R828.153 million in 2024/25. The increase is due to the implementation of the ICS as well as the filling of the new organisational structure. In 2025/26, the budget increases by 8.6 per cent to R899.099 million when compared to the 2024/25 revised estimate due to the provision to fill critical posts in an effort to improve service delivery and capacitating the department to fulfil its mandate as well as the provision for the wage agreement implementation. Expenditure on Goods and Services increased from R862.756 million in 2021/22 to a revised estimate of R964.873 million 2024/25. The increase is due to the escalating demand for office space, the improvement in the property management portfolio and the reclassification for NYS and APTCoD learners. In 2025/26, the budget decreases by 3.8 per cent to R928.306 million when compared to 301
