
Page 326 - Demo
P. 326
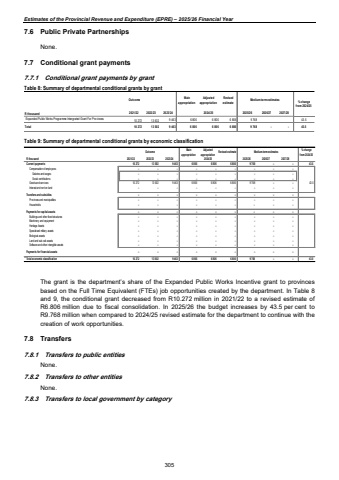
Estimates of the Provincial Revenue and Expenditure (EPRE) %u2013 2025/26 Financial Year7.6 Public Private Partnerships None. 7.7 Conditional grant payments 7.7.1 Conditional grant payments by grant Table 8: Summary of departmental conditional grants by grant Outcome Mainappropriation Adjusted appropriation Revised estimate 2021/22 2022/23 2023/24 2024/25 2025/26 2026/27 2027/28 10 272 13 502 9 463 6 806 6 806 6 806 9 768 43.5 Total 10 272 13 502 9 463 6 806 6 806 6 806 9 768 - - 43.5 R thousand % change from 2024/25 Expanded Public Works Programme Intergrated Grant For Provinces Medium-term estimatesTable 9: Summary of departmental conditional grants by economic classification Outcome Main appropriationAdjusted appropriation Revised estimate Medium-term estimates % change from 2024/25R thousand 2021/22 2022/23 2023/24 2025/26 2026/27 2027/28Current payments 13 502 10 272 9 463 6 806 6 806 6 806 9 768 %u2013 %u2013 43.5Compensation of employees %u2013 %u2013 %u2013 %u2013 %u2013 %u2013 %u2013 %u2013 %u2013 Salaries and wages %u2013 %u2013 %u2013 %u2013 %u2013 %u2013 %u2013 %u2013 %u2013 Social contributions %u2013 %u2013 %u2013 %u2013 %u2013 %u2013 %u2013 %u2013 %u2013 Goods and services 13 502 10 272 9 463 6 806 6 806 6 806 9 768 %u2013 %u2013 43.5Interest and rent on land %u2013 %u2013 %u2013 %u2013 %u2013 %u2013 %u2013 %u2013 %u2013 Transfers and subsidies %u2013 %u2013 %u2013 %u2013 %u2013 %u2013 %u2013 %u2013 %u2013 Provinces and municipalities %u2013 %u2013 %u2013 %u2013 %u2013 %u2013 %u2013 %u2013 %u2013 Households %u2013 %u2013 %u2013 %u2013 %u2013 %u2013 %u2013 %u2013 %u2013Payments for capital assets %u2013 %u2013 %u2013 %u2013 %u2013 %u2013 %u2013 %u2013 %u2013Buildings and other fixed structures %u2013 %u2013 %u2013 %u2013 %u2013 %u2013 %u2013 %u2013 %u2013Machinery and equipment %u2013 %u2013 %u2013 %u2013 %u2013 %u2013 %u2013 %u2013 %u2013Heritage Assets %u2013 %u2013 %u2013 %u2013 %u2013 %u2013 %u2013 %u2013 %u2013Specialised military assets %u2013 %u2013 %u2013 %u2013 %u2013 %u2013 %u2013 %u2013 %u2013Biological assets %u2013 %u2013 %u2013 %u2013 %u2013 %u2013 %u2013 %u2013 %u2013Land and sub-soil assets %u2013 %u2013 %u2013 %u2013 %u2013 %u2013 %u2013 %u2013 %u2013Software and other intangible assets %u2013 %u2013 %u2013 %u2013 %u2013 %u2013 %u2013 %u2013 %u2013Payments for financial assets %u2013 %u2013 %u2013 %u2013 %u2013 %u2013 %u2013 %u2013 %u2013Total economic classification 10 272 13 502 9 463 6 806 6 806 6 806 9 768 %u2013 %u2013 43.52024/25The grant is the department%u2019s share of the Expanded Public Works Incentive grant to provinces based on the Full Time Equivalent (FTEs) job opportunities created by the department. In Table 8 and 9, the conditional grant decreased from R10.272 million in 2021/22 to a revised estimate of R6.806 million due to fiscal consolidation. In 2025/26 the budget increases by 43.5 per cent to R9.768 million when compared to 2024/25 revised estimate for the department to continue with the creation of work opportunities. 7.8 Transfers 7.8.1 Transfers to public entities None. 7.8.2 Transfers to other entities None. 7.8.3 Transfers to local government by category 305
