
Page 323 - Demo
P. 323
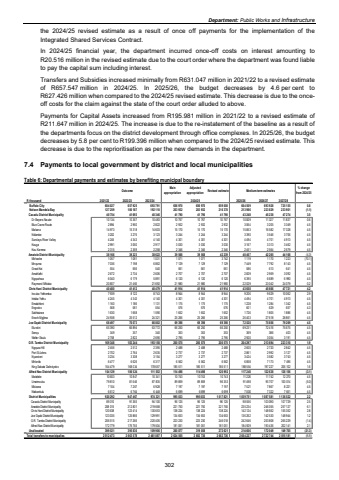
Department: Public Works and Infrastructurethe 2024/25 revised estimate as a result of once off payments for the implementation of the Integrated Shared Services Contract. In 2024/25 financial year, the department incurred once-off costs on interest amounting to R20.516 million in the revised estimate due to the court order where the department was found liable to pay the capital sum including interest. Transfers and Subsidies increased minimally from R631.047 million in 2021/22 to a revised estimate of R657.547 million in 2024/25. In 2025/26, the budget decreases by 4.6 per cent to R627.426 million when compared to the 2024/25 revised estimate. This decrease is due to the onceoff costs for the claim against the state of the court order alluded to above. Payments for Capital Assets increased from R195.981 million in 2021/22 to a revised estimate of R211.647 million in 2024/25. The increase is due to the re-instatement of the baseline as a result of the departments focus on the district development through office complexes. In 2025/26, the budget decreases by 5.8 per cent to R199.396 million when compared to the 2024/25 revised estimate. This decrease is due to the reprioritisation as per the new demands in the department. 7.4 Payments to local government by district and local municipalities Table 6: Departmental payments and estimates by benefiting municipal boundary Outcome Main appropriationAdjusted appropriation Revised estimate Medium-term estimates % change from 2024/25R thousand 2021/22 2022/23 2023/24 2025/26 2026/27 2027/28 Buffalo City 604 027 657 925 693 791 656 970 656 970 659 008 664 509 693 928 725 155 0.8 Nelson Mandela Bay 127 259 180 187 192 110 203 932 203 932 216 378 213 986 223 829 233 901 (1.1)Cacadu District Municipality 40 754 41 693 40 346 41 790 41 790 41 790 43 248 45 238 47 274 3.5 Dr Beyers Naude 10 134 10 367 10 483 10 767 10 767 10 767 10 829 11 327 11 837 0.6 Blue Crane Route 2 894 2 960 2 822 2 932 2 932 2 932 3 064 3 205 3 349 4.5 Makana 14 973 15 318 14 603 15 170 15 170 15 170 15 853 16 582 17 328 4.5 Ndlambe 3 202 3 276 3 123 3 244 3 244 3 244 3 390 3 546 3 706 4.5 Sundays River Valley 4 245 4 343 4 140 4 301 4 301 4 301 4 494 4 701 4 913 4.5 Kouga 2 991 3 060 2 917 3 030 3 030 3 030 3 167 3 313 3 462 4.5 Kou-Kamma 2 315 2 369 2 258 2 346 2 346 2 346 2 451 2 564 2 679 4.5Amatole District Municipality 38 166 39 223 38 622 39 568 39 568 42 239 40 407 42 265 44 168 (4.3) Mbhashe 1 057 1 081 1 031 1 071 1 071 3 742 1 119 1 170 1 223 (70.1) Mnquma 7 036 7 198 6 862 7 129 7 129 7 129 7 449 7 792 8 143 4.5 Great Kei 554 566 540 561 561 561 586 613 641 4.5 Amahlathi 2 672 2 734 2 606 2 707 2 707 2 707 2 829 2 959 3 092 4.5 Ngqushwa 6 040 6 179 5 891 6 120 6 120 6 120 6 395 6 689 6 990 4.5 Raymond Mhlaba 20 807 21 465 21 692 21 980 21 980 21 980 22 029 23 042 24 079 0.2Chris Hani District Municipality 40 480 41 412 40 479 41 914 41 914 41 914 43 658 45 666 47 721 4.2 Inxuba Yethemba 7 939 8 122 8 743 8 944 8 944 8 944 9 206 10 062 9 629 2.9 Intsika Yethu 4 245 4 343 4 140 4 301 4 301 4 301 4 494 4 701 4 913 4.5 Emalahleni 1 160 1 186 1 131 1 175 1 175 1 175 1 228 1 284 1 342 4.5 Engcobo 568 581 554 576 576 576 601 629 657 4.3 Sakhisizwe 1 630 1 668 1 590 1 652 1 652 1 652 1 726 1 805 1 886 4.5 Enoch Mgijima 24 938 25 512 24 321 25 266 25 266 25 266 26 403 27 618 28 861 4.5Joe Gqabi District Municipality 68 497 70 073 66 802 69 398 69 398 69 398 72 520 75 856 79 269 4.5 Elundini 65 390 66 894 63 772 66 250 66 250 66 250 69 231 72 416 75 675 4.5 Senqu 349 357 340 353 353 353 369 386 403 4.5 Walter Sisulu 2 758 2 822 2 690 2 795 2 795 2 795 2 920 3 054 3 191 4.5O.R. Tambo District Municipality 169 348 183 244 193 158 200 575 200 575 200 575 204 297 213 694 223 310 1.9 Ngquza Hill 2 456 2 512 2 395 2 488 2 488 2 488 2 600 2 720 2 842 4.5 Port St Johns 2 702 2 764 2 635 2 737 2 737 2 737 2 861 2 992 3 127 4.5 Nyandeni 3 234 3 308 3 154 3 277 3 277 3 277 3 424 3 582 3 743 4.5 Mhlontlo 6 477 6 626 6 317 6 562 6 562 6 562 6 858 7 173 7 496 4.5 King Sabata Dalindyebo 154 479 168 034 178 657 185 511 185 511 185 511 188 554 197 227 206 102 1.6Alfred Nzo District Municipality 104 129 106 524 111 552 114 498 114 498 120 992 117 245 122 638 128 156 (3.1) Matatiele 10 603 10 847 10 341 10 743 10 743 10 743 11 226 11 742 12 270 4.5 Umzimvubu 79 810 81 646 87 835 89 859 89 859 96 353 91 498 100 014 95 707 (5.0) Mbizana 7 104 7 267 6 928 7 197 7 197 7 197 7 521 7 867 8 221 4.5 Ntabankulu 6 612 6 764 6 448 6 699 6 699 6 699 7 000 7 322 7 651 4.5District Municipalities 920 292 947 467 974 321 995 033 995 033 1 017 821 1 039 751 1 087 581 1 136 522 2.2Cacadu District Municipality 89 310 91 365 94 100 96 125 96 125 96 125 98 556 103 090 107 729 2.5Amatole District Municipality 208 015 212 801 219 668 221 750 221 750 221 750 235 234 246 055 257 127 6.1Chris Hani District Municipality 120 638 123 414 130 653 138 224 138 224 138 224 142 124 148 662 155 352 2.8Joe Gqabi District Municipality 123 035 125 866 129 991 134 653 134 653 134 653 136 262 142 530 148 944 1.2O.R. Tambo District Municipality 206 515 217 266 220 405 223 230 223 230 246 018 242 646 253 808 265 229 (1.4)Alfred Nzo District Municipality 172 779 176 755 179 504 181 051 181 051 181 051 184 929 193 436 202 141 2.1Unallocated 399 521 395 830 109 906 260 877 319 058 272 621 214 606 172 049 149 705 (21.3)Total transfers to municipalies 2 512 473 2 663 578 2 461 087 2 624 555 2 682 736 2 682 736 2 654 227 2 722 744 2 815 181 (1.1)2024/25302
