
Page 330 - Demo
P. 330
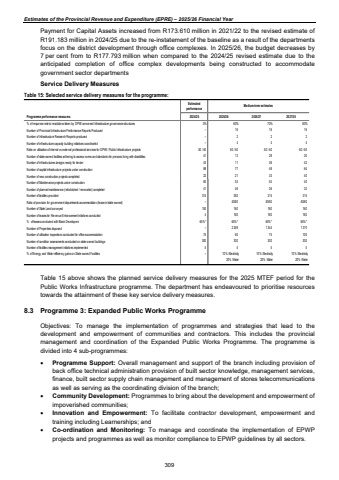
Estimates of the Provincial Revenue and Expenditure (EPRE) %u2013 2025/26 Financial YearPayment for Capital Assets increased from R173.610 million in 2021/22 to the revised estimate of R191.183 million in 2024/25 due to the re-instatement of the baseline as a result of the departments focus on the district development through office complexes. In 2025/26, the budget decreases by 7 per cent from to R177.793 million when compared to the 2024/25 revised estimate due to the anticipated completion of office complex developments being constructed to accommodate government sector departments Service Delivery Measures Table 15: Selected service delivery measures for the programme: Estimatedperformance Medium-term estimatesProgramme performance measures 2024/25 2025/26 2026/27 2027/28% of response rate to resolutions taken by DPWI convened Infrastructure governance structures 0% 60% 70% 80%Number of Provincial Infrastructure Performance Reports Produced 16 %u2013 16 16 Number of Infrastructure Research Reports produced 2 %u2013 2 2 Number of infrastructure capacity building initiatives coordinated 4 %u2013 4 4 Ratio on utilisation of internal vs external professional services for DPWI / Public Infrastructure projects 50 / 50 50 / 50 50 / 50 50 / 50Number of state-owned facilities adhering to access norms and standards for persons living with disabilities 13 41 28 30 Number of infrastructures designs ready for tender 11 43 36 42 Number of capital infrastructure projects under construction 77 88 48 64 Number of new construction projects completed 21 22 33 40 Number of Maintenance projects under construction 53 60 53 40 Number of planned maintenance (refurbished / renovated) completed 46 41 26 32 Number of facilities provided 383 314 315 315 Ratio of provision for government departments accommodation (lease-in/state-owned) 40/60 50/50 40/60 %u2013Number of State Land surveyed 160 150 160 160 Number of leases for Revenue Enhancement initiatives concluded 160 4 160 160 % of leases concluded with Black Developers 65% * 65%* 65% * 65%*Number of Properties disposed 2 269 %u2013 1 344 1 370 Number of utilisation inspections conducted for office accommodation 60 75 75 100 Number of condition assessments conducted on state-owned buildings 300 300 300 300Number of facilities management initiatives implemented 5 5 5 5% of Energy and Water efficiency gains on State-owned Facilities %u2013 10% Electricity 20% Water 10% Electricity 20% Water 10% Electricity 20% Water Table 15 above shows the planned service delivery measures for the 2025 MTEF period for the Public Works Infrastructure programme. The department has endeavoured to prioritise resources towards the attainment of these key service delivery measures. 8.3 Programme 3: Expanded Public Works Programme Objectives: To manage the implementation of programmes and strategies that lead to the development and empowerment of communities and contractors. This includes the provincial management and coordination of the Expanded Public Works Programme. The programme is divided into 4 sub-programmes: %uf0b7 Programme Support: Overall management and support of the branch including provision of back office technical administration provision of built sector knowledge, management services, finance, built sector supply chain management and management of stores telecommunications as well as serving as the coordinating division of the branch; %uf0b7 Community Development: Programmes to bring about the development and empowerment of impoverished communities; %uf0b7 Innovation and Empowerment: To facilitate contractor development, empowerment and training including Learnerships; and %uf0b7 Co-ordination and Monitoring: To manage and coordinate the implementation of EPWP projects and programmes as well as monitor compliance to EPWP guidelines by all sectors. 309
