
Page 327 - Demo
P. 327
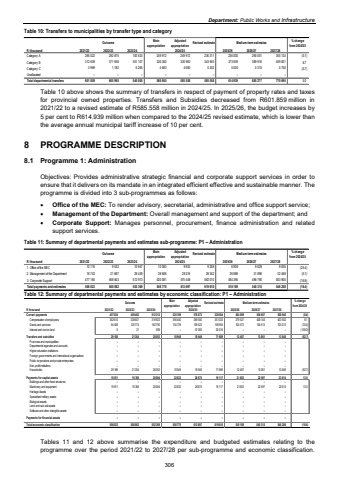
Department: Public Works and InfrastructureTable 10: Transfers to municipalities by transfer type and category Outcome Main appropriationAdjusted appropriation Revised estimate Medium-term estimates % change from 2024/25R thousand 2021/22 2022/23 2023/24 2025/26 2026/27 2027/28Category A 292 875 285 022 182 633 249 912 249 912 236 311 236 000 290 051 355 124 (0.1)Category B 371 938 312 838 351 107 326 360 330 963 343 945 373 939 389 916 409 821 8.7Category C 3 999 1 182 6 265 4 683 4 683 5 302 5 000 5 310 5 750 (5.7)Unallocated %u2013 %u2013 %u2013 %u2013 %u2013 %u2013 %u2013 %u2013 %u2013Total departmental transfers 601 859 665 995 540 005 580 955 585 558 585 558 614 939 685 277 770 695 5.02024/25Table 10 above shows the summary of transfers in respect of payment of property rates and taxes for provincial owned properties. Transfers and Subsidies decreased from R601.859 million in 2021/22 to a revised estimate of R585.558 million in 2024/25. In 2025/26, the budget increases by 5 per cent to R614.939 million when compared to the 2024/25 revised estimate, which is lower than the average annual municipal tariff increase of 10 per cent. 8 PROGRAMME DESCRIPTION 8.1 Programme 1: Administration Objectives: Provides administrative strategic financial and corporate support services in order to ensure that it delivers on its mandate in an integrated efficient effective and sustainable manner. The programme is divided into 3 sub-programmes as follows: %uf0b7 Office of the MEC: To render advisory, secretarial, administrative and office support service; %uf0b7 Management of the Department: Overall management and support of the department; and %uf0b7 Corporate Support: Manages personnel, procurement, finance administration and related support services. Table 11: Summary of departmental payments and estimates sub-programme: P1 %u2013 Administration Outcome Main appropriationAdjusted appropriation Revised estimate Medium-term estimates % change from 2024/25R thousand 2021/22 2022/23 2023/24 2025/26 2026/27 2027/281. Office of the MEC 9 532 10 116 10 947 10 083 9 933 9 258 6 906 9 629 9 835 (25.4)2. Management of the Department 21 687 18 742 28 449 28 606 28 316 28 342 26 888 31 896 32 468 (5.1)3. Corporate Support 468 843 477 165 512 973 520 081 575 448 582 010 484 395 498 790 503 905 (16.8)Total payments and estimates 500 062 506 023 552 369 558 770 613 697 619 610 518 189 540 315 546 208 (16.4)2024/25Table 12: Summary of departmental payments and estimates by economic classification: P1 %u2013 Administration Outcome Main appropriationAdjusted appropriation Revised estimate Medium-term estimates % change from 2024/25R thousand 2021/22 2022/23 2023/24 2025/26 2026/27 2027/28Current payments 457 024 459 402 512 312 525 189 576 073 528 504 484 099 504 657 508 945 (8.4)Compensation of employees 362 610 338 607 318 923 390 450 359 550 351 033 379 527 400 144 403 932 8.1Goods and services 94 408 120 774 192 790 134 739 159 523 156 955 104 572 104 513 105 013 (33.4)Interest and rent on land 6 21 599 %u2013 57 000 20 516 %u2013 %u2013 %u2013 (100.0)Transfers and subsidies 29 188 21 304 20 053 10 949 10 949 71 989 12 487 13 061 13 649 (82.7)Provinces and municipalities %u2013 %u2013 %u2013 %u2013 %u2013 %u2013 %u2013 %u2013 %u2013Departmental agencies and accounts %u2013 %u2013 %u2013 %u2013 %u2013 %u2013 %u2013 %u2013 %u2013Higher education institutions %u2013 %u2013 %u2013 %u2013 %u2013 %u2013 %u2013 %u2013 %u2013Foreign governments and international organisations %u2013 %u2013 %u2013 %u2013 %u2013 %u2013 %u2013 %u2013 %u2013Public corporations and private enterprises %u2013 %u2013 %u2013 %u2013 %u2013 %u2013 %u2013 %u2013 %u2013Non-profit institutions %u2013 %u2013 %u2013 %u2013 %u2013 %u2013 %u2013 %u2013 %u2013Households 29 188 21 304 20 053 10 949 10 949 71 989 12 487 13 061 13 649 (82.7)Payments for capital assets 19 811 19 356 20 004 22 632 26 675 19 117 21 603 22 597 23 614 13.0Buildings and other fixed structures %u2013 %u2013 %u2013 %u2013 %u2013 %u2013 %u2013 %u2013 %u2013Machinery and equipment 19 811 19 356 20 004 22 632 26 675 19 117 21 603 22 597 23 614 13.0Heritage Assets %u2013 %u2013 %u2013 %u2013 %u2013 %u2013 %u2013 %u2013 %u2013Specialised military assets %u2013 %u2013 %u2013 %u2013 %u2013 %u2013 %u2013 %u2013 %u2013Biological assets %u2013 %u2013 %u2013 %u2013 %u2013 %u2013 %u2013 %u2013 %u2013Land and sub-soil assets %u2013 %u2013 %u2013 %u2013 %u2013 %u2013 %u2013 %u2013 %u2013Software and other intangible assets %u2013 %u2013 %u2013 %u2013 %u2013 %u2013 %u2013 %u2013 %u2013Payments for financial assets %u2013 %u2013 %u2013 %u2013 %u2013 %u2013 %u2013 %u2013 %u2013Total economic classification 506 023 500 062 552 369 558 770 613 697 619 610 518 189 540 315 546 208 (16.4)2024/25 Tables 11 and 12 above summarise the expenditure and budgeted estimates relating to the programme over the period 2021/22 to 2027/28 per sub-programme and economic classification. 306
