
Page 332 - Demo
P. 332
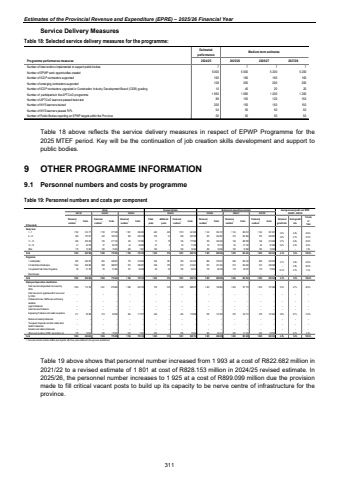
Estimates of the Provincial Revenue and Expenditure (EPRE) %u2013 2025/26 Financial YearService Delivery Measures Table 18: Selected service delivery measures for the programme: Estimatedperformance Medium-term estimatesProgramme performance measures 2024/25 2025/26 2026/27 2027/28Number of interventions implemented to support public bodies 7 7 7 7 Number of EPWP work opportunities created 5 000 5 000 5 200 5 200 Number of ICDP contractors supported 160 160 160 160 Number of emerging contractors supported 200 108 200 200 Number of ICDP contractors upgraded in Construction Industry Development Board (CIDB) grading 40 10 20 20 Number of participants in the APTCoD programme 1 060 1 060 1 200 1 200 Number of APTCoD learners passed trade test 105 88 120 150 Number of NYS learners trained 150 200 150 150 Number of NYS learners passed RPL 50 54 50 50 Number of Public Bodies reporting on EPWP targets within the Province 50 50 50 50 Table 18 above reflects the service delivery measures in respect of EPWP Programme for the 2025 MTEF period. Key will be the continuation of job creation skills development and support to public bodies. 9 OTHER PROGRAMME INFORMATION 9.1 Personnel numbers and costs by programme Table 19: Personnel numbers and costs per component Actual Revised estimate Medium-term expenditure estimateR thousandsPersonnel numbers1 Costs Personnel numbers1 Costs Personnel numbers1 Costs Filled postsAdditional postsPersonnel numbers1 Costs Personnel numbers1 Costs Personnel numbers1 Costs Personnel numbers1 Costs Personnel growth rate Costs growth rate % Costs of Total Salary level1 %u2013 7 1 182 314 177 1 100 271 038 1 021 336 200 643 430 1 073 341 800 1 144 354 157 1 144 365 012 1 144 391 357 2.2% 4.6% 40.4%8 %u2013 10 385 197 671 342 192 478 343 206 738 278 61 339 220 768 370 244 891 370 252 465 370 260 587 3.0% 5.7% 27.0%11 %u2013 12 206 230 234 195 217 165 145 137 990 77 79 156 177 992 169 204 239 169 208 708 169 215 596 2.7% 6.6% 22.2%13 %u2013 16 41 65 576 37 83 195 54 66 839 47 6 53 71 499 62 79 718 62 81 154 62 81 689 5.4% 4.5% 8.6%Other 179 15 024 182 15 504 223 7 361 180 %u2013 180 16 094 180 16 094 180 16 094 180 16 094 %u2013 %u2013 1.8%Total 1 993 822 682 1 856 779 380 1 786 755 128 1 225 576 1 801 828 153 1 925 899 099 1 925 923 433 1 925 965 323 2.2% 5.2% 100.0%Programme1. Administration 850 362 610 805 338 607 775 318 923 504 281 785 351 033 836 379 527 836 400 144 836 403 932 2.1% 4.8% 42.5%2. Public Works Infrastructure 1 044 408 369 958 388 879 910 380 947 638 272 910 413 601 910 451 404 910 453 532 910 490 588 %u2013 5.9% 50.0%3. Expanded Public Works Programme 99 51 703 93 51 894 101 55 258 83 23 106 63 519 179 68 168 179 69 757 179 70 803 19.1% 3.7% 7.5%Direct charges %u2013 %u2013 %u2013 %u2013 %u2013 %u2013 %u2013 %u2013 %u2013 %u2013 %u2013 %u2013 %u2013 %u2013 %u2013 %u2013 %u2013 %u2013 %u2013Total 1 993 822 682 1 856 779 380 1 786 755 128 1 225 576 1 801 828 153 1 925 899 099 1 925 923 433 1 925 965 323 2.2% 5.2% 100.0%Employee dispensation classificationPublic Service Act appointees not covered by OSDs 1 603 714 794 1 461 679 886 1 339 630 190 753 576 1 329 688 973 1 423 746 965 1 423 757 178 1 423 791 586 2.3% 4.7% 82.4%Public Service Act appointees still to be covered by OSDs %u2013 %u2013 %u2013 %u2013 %u2013 %u2013 %u2013 %u2013 %u2013 %u2013 %u2013 %u2013 %u2013 %u2013 %u2013 %u2013 %u2013 %u2013 %u2013Professional Nurses, Staff Nurses and Nursing Assistants %u2013 %u2013 %u2013 %u2013 %u2013 %u2013 %u2013 %u2013 %u2013 %u2013 %u2013 %u2013 %u2013 %u2013 %u2013 %u2013 %u2013 %u2013 %u2013Legal Professionals %u2013 %u2013 %u2013 %u2013 %u2013 %u2013 %u2013 %u2013 %u2013 %u2013 %u2013 %u2013 %u2013 %u2013 %u2013 %u2013 %u2013 %u2013 %u2013Social Services Professions %u2013 %u2013 %u2013 %u2013 %u2013 %u2013 %u2013 %u2013 %u2013 %u2013 %u2013 %u2013 %u2013 %u2013 %u2013 %u2013 %u2013 %u2013 %u2013Engineering Professions and related occupations 211 92 384 215 83 992 224 117 577 246 %u2013 246 119 928 276 131 920 276 145 112 276 151 643 3.9% 8.1% 15.3%Medical and related professionals %u2013 %u2013 %u2013 %u2013 %u2013 %u2013 %u2013 %u2013 %u2013 %u2013 %u2013 %u2013 %u2013 %u2013 %u2013 %u2013 %u2013 %u2013 %u2013Therapeutic, Diagnostic and other related Allied Health Professionals %u2013 %u2013 %u2013 %u2013 %u2013 %u2013 %u2013 %u2013 %u2013 %u2013 %u2013 %u2013 %u2013 %u2013 %u2013 %u2013 %u2013 %u2013 %u2013Educators and related professionals %u2013 %u2013 %u2013 %u2013 %u2013 %u2013 %u2013 %u2013 %u2013 %u2013 %u2013 %u2013 %u2013 %u2013 %u2013 %u2013 %u2013 %u2013 %u2013Others such as interns, EPWP, learnerships, etc 179 15 504 180 15 502 223 7 361 226 %u2013 226 19 252 226 20 214 226 21 143 226 22 094 %u2013 4.7% 2.3%Total 1 993 822 682 1 856 779 380 1 786 755 128 1 225 576 1 801 828 153 1 925 899 099 1 925 923 433 1 925 965 323 2.2% 5.2% 100.0%1. Personnel numbers includes all filled posts together with those posts additional to the approved establishment Average annual growth over MTEF 2021/22 2022/23 2023/24 2024/25 2025/26 2026/27 2027/28 2024/25 - 2027/28Table 19 above shows that personnel number increased from 1 993 at a cost of R822.682 million in 2021/22 to a revised estimate of 1 801 at cost of R828.153 million in 2024/25 revised estimate. In 2025/26, the personnel number increases to 1 925 at a cost of R899.099 million due the provision made to fill critical vacant posts to build up its capacity to be nerve centre of infrastructure for the province. 311
