
Page 329 - Demo
P. 329
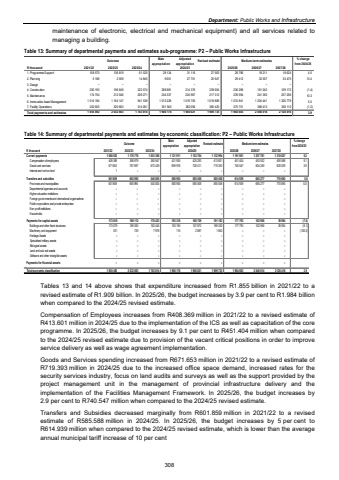
Department: Public Works and Infrastructuremaintenance of electronic, electrical and mechanical equipment) and all services related to managing a building. Table 13: Summary of departmental payments and estimates sub-programme: P2 %u2013 Public Works Infrastructure Outcome Main appropriationAdjusted appropriation Revised estimate Medium-term estimates % change from 2024/25R thousand 2021/22 2022/23 2023/24 2025/26 2026/27 2027/281. Programme Support 136 819 158 570 61 525 28 134 31 116 27 563 28 796 18 211 18 624 4.52. Planning 2 559 5 186 14 845 9 651 27 751 25 947 29 412 32 557 33 475 13.43. Design %u2013 %u2013 %u2013 %u2013 %u2013 %u2013 %u2013 %u2013 %u2013 4. Construction 196 649 250 193 222 574 268 881 214 376 239 604 236 289 161 042 109 172 (1.4)5. Maintenance 212 046 174 754 209 271 234 337 224 967 217 312 239 594 241 350 257 256 10.36. Immovable Asset Management 1 164 147 1 014 184 941 538 1 013 228 1 019 755 1 018 889 1 074 841 1 204 441 1 326 779 5.57. Facility Operations 320 663 252 605 314 061 351 945 382 056 380 420 375 751 388 413 383 110 (1.2)Total payments and estimates 2 032 883 1 855 492 1 763 814 1 906 176 1 900 021 1 909 735 1 984 683 2 046 014 2 128 416 3.92024/25 Table 14: Summary of departmental payments and estimates by economic classification: P2 %u2013 Public Works Infrastructure Outcome Main appropriationAdjusted appropriation Revised estimate Medium-term estimates % change from 2024/25R thousand 2021/22 2022/23 2023/24 2025/26 2026/27 2027/28Current payments 1 080 023 1 176 776 1 053 386 1 131 911 1 153 704 1 132 994 1 191 951 1 257 781 1 318 627 5.2Compensation of employees 408 369 388 879 380 947 431 935 425 293 413 601 451 404 453 532 490 588 9.1Goods and services 671 653 787 897 672 439 699 976 728 411 719 393 740 547 804 249 828 039 2.9Interest and rent on land 1 %u2013 %u2013 %u2013 %u2013 %u2013 %u2013 %u2013 %u2013 Transfers and subsidies 601 859 665 995 540 005 580 955 585 558 585 558 614 939 685 277 770 695 5.0 Provinces and municipalities 601 859 665 995 540 005 580 955 585 558 585 558 614 939 685 277 770 695 5.0Departmental agencies and accounts %u2013 %u2013 %u2013 %u2013 %u2013 %u2013 %u2013 %u2013 %u2013 Higher education institutions %u2013 %u2013 %u2013 %u2013 %u2013 %u2013 %u2013 %u2013 %u2013 Foreign governments and international organisations %u2013 %u2013 %u2013 %u2013 %u2013 %u2013 %u2013 %u2013 %u2013 Public corporations and private enterprises %u2013 %u2013 %u2013 %u2013 %u2013 %u2013 %u2013 %u2013 %u2013Non-profit institutions %u2013 %u2013 %u2013 %u2013 %u2013 %u2013 %u2013 %u2013 %u2013Households %u2013 %u2013 %u2013 %u2013 %u2013 %u2013 %u2013 %u2013 %u2013Payments for capital assets 173 610 190 112 170 423 193 310 160 759 191 183 177 793 102 956 39 094 (7.0)Buildings and other fixed structures 173 079 189 383 162 445 193 195 157 872 189 330 177 793 102 956 39 094 (6.1)Machinery and equipment 531 729 7 978 115 2 887 1 853 %u2013 %u2013 %u2013 (100.0)Heritage Assets %u2013 %u2013 %u2013 %u2013 %u2013 %u2013 %u2013 %u2013 %u2013Specialised military assets %u2013 %u2013 %u2013 %u2013 %u2013 %u2013 %u2013 %u2013 %u2013Biological assets %u2013 %u2013 %u2013 %u2013 %u2013 %u2013 %u2013 %u2013 %u2013Land and sub-soil assets %u2013 %u2013 %u2013 %u2013 %u2013 %u2013 %u2013 %u2013 %u2013Software and other intangible assets %u2013 %u2013 %u2013 %u2013 %u2013 %u2013 %u2013 %u2013 %u2013Payments for financial assets %u2013 %u2013 %u2013 %u2013 %u2013 %u2013 %u2013 %u2013 %u2013Total economic classification 1 855 492 2 032 883 1 763 814 1 906 176 1 900 021 1 909 735 1 984 683 2 046 014 2 128 416 3.92024/25Tables 13 and 14 above shows that expenditure increased from R1.855 billion in 2021/22 to a revised estimate of R1.909 billion. In 2025/26, the budget increases by 3.9 per cent to R1.984 billion when compared to the 2024/25 revised estimate. Compensation of Employees increases from R408.369 million in 2021/22 to a revised estimate of R413.601 million in 2024/25 due to the implementation of the ICS as well as capacitation of the core programme. In 2025/26, the budget increases by 9.1 per cent to R451.404 million when compared to the 2024/25 revised estimate due to provision of the vacant critical positions in order to improve service delivery as well as wage agreement implementation. Goods and Services spending increased from R671.653 million in 2021/22 to a revised estimate of R719.393 million in 2024/25 due to the increased office space demand, increased rates for the security services industry, focus on land audits and surveys as well as the support provided by the project management unit in the management of provincial infrastructure delivery and the implementation of the Facilities Management Framework. In 2025/26, the budget increases by 2.9 per cent to R740.547 million when compared to the 2024/25 revised estimate. Transfers and Subsidies decreased marginally from R601.859 million in 2021/22 to a revised estimate of R585.588 million in 2024/25. In 2025/26, the budget increases by 5 per cent to R614.939 million when compared to the 2024/25 revised estimate, which is lower than the average annual municipal tariff increase of 10 per cent 308
