
Page 339 - Demo
P. 339
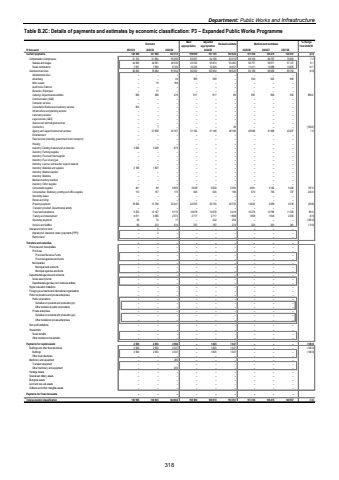
Department: Public Works and InfrastructureTable B.2C: Details of payments and estimates by economic classification: P3 %u2013 Expanded Public Works Programme Outcome Main appropriationAdjusted appropriation Revised estimate Medium-term estimates % change from 2024/25R thousand 2021/22 2022/23 2023/24 2025/26 2026/27 2027/28Current payments 127 980 148 398 142 312 159 609 167 193 152 044 151 356 136 415 140 557 (0.5)Compensation of employees 51 703 51 894 55 258 63 657 64 199 63 519 68 168 69 757 70 803 7.3Salaries and wages 44 066 44 091 46 538 53 332 53 874 53 482 56 757 56 671 57 127 6.1Social contributions 7 637 7 803 8 720 10 325 10 325 10 037 11 411 13 086 13 676 13.7Goods and services 76 084 96 695 87 054 95 952 102 994 88 525 83 188 66 658 69 754 (6.0)Administrative fees %u2013 %u2013 %u2013 %u2013 %u2013 %u2013 %u2013 %u2013 %u2013 Advertising %u2013 %u2013 24 569 569 %u2013 594 622 650 Minor assets 19 %u2013 184 %u2013 %u2013 %u2013 %u2013 %u2013 %u2013 Audit costs: External %u2013 %u2013 %u2013 %u2013 %u2013 %u2013 %u2013 %u2013 %u2013Bursaries: Employees %u2013 17 %u2013 %u2013 %u2013 %u2013 %u2013 %u2013 %u2013Catering: Departmental activities 586 580 479 817 817 89 853 892 932 858.4Communication (G&S) %u2013 %u2013 %u2013 %u2013 %u2013 %u2013 %u2013 %u2013 %u2013Computer services %u2013 %u2013 %u2013 %u2013 %u2013 %u2013 %u2013 %u2013 %u2013Consultants: Business and advisory services 254 %u2013 %u2013 %u2013 %u2013 %u2013 %u2013 %u2013 %u2013Infrastructure and planning services %u2013 %u2013 %u2013 %u2013 %u2013 %u2013 %u2013 %u2013 %u2013Laboratory services %u2013 %u2013 %u2013 %u2013 %u2013 %u2013 %u2013 %u2013 %u2013Legal services (G&S) %u2013 %u2013 %u2013 %u2013 %u2013 %u2013 %u2013 %u2013 %u2013Science and technological services %u2013 %u2013 %u2013 %u2013 %u2013 %u2013 %u2013 %u2013 %u2013Contractors %u2013 7 %u2013 %u2013 %u2013 28 %u2013 %u2013 %u2013 (100.0)Agency and support/outsourced services %u2013 37 838 45 107 51 166 51 166 48 166 49 086 41 088 42 937 1.9Entertainment %u2013 %u2013 %u2013 %u2013 %u2013 %u2013 %u2013 %u2013 %u2013Fleet services (including government motor transport) %u2013 %u2013 %u2013 %u2013 %u2013 %u2013 %u2013 %u2013 %u2013Housing %u2013 %u2013 %u2013 %u2013 %u2013 %u2013 %u2013 %u2013 %u2013Inventory: Clothing material and accessories 3 006 3 249 673 %u2013 %u2013 %u2013 %u2013 %u2013 %u2013Inventory: Farming supplies %u2013 %u2013 %u2013 %u2013 %u2013 %u2013 %u2013 %u2013 %u2013Inventory: Food and food supplies %u2013 %u2013 %u2013 %u2013 %u2013 %u2013 %u2013 %u2013 %u2013Inventory: Fuel, oil and gas %u2013 %u2013 %u2013 %u2013 %u2013 %u2013 %u2013 %u2013 %u2013Inventory: Learner and teacher support material %u2013 %u2013 %u2013 %u2013 %u2013 %u2013 %u2013 %u2013 %u2013Inventory: Materials and supplies 2 188 1 837 %u2013 %u2013 %u2013 %u2013 %u2013 %u2013 %u2013Inventory: Medical supplies %u2013 %u2013 %u2013 %u2013 %u2013 %u2013 %u2013 %u2013 %u2013Inventory: Medicine %u2013 %u2013 %u2013 %u2013 %u2013 %u2013 %u2013 %u2013 %u2013Medsas inventory interface %u2013 %u2013 %u2013 %u2013 %u2013 %u2013 %u2013 %u2013 %u2013Inventory: Other supplies %u2013 %u2013 %u2013 %u2013 %u2013 %u2013 %u2013 %u2013 %u2013Consumable supplies 491 80 5 659 5 638 5 638 2 356 4 891 5 162 5 440 107.6Consumables: Stationery, printing and office supplies 113 157 173 645 645 196 674 705 737 243.9Operating leases %u2013 %u2013 %u2013 %u2013 %u2013 %u2013 %u2013 %u2013 %u2013Rental and hiring %u2013 %u2013 %u2013 %u2013 %u2013 %u2013 %u2013 %u2013 %u2013Property payments 76 066 15 790 22 441 22 935 29 735 29 735 14 633 5 089 5 318 (50.8)Transport provided: Departmental activity %u2013 %u2013 %u2013 %u2013 %u2013 %u2013 %u2013 %u2013 %u2013Travel and subsistence 9 253 13 157 9 710 10 678 10 678 5 419 10 276 10 796 11 329 89.6Training and development 4 611 3 066 2 073 2 717 2 717 1 868 1 858 1 943 2 030 (0.5)Operating payments 38 74 17 %u2013 242 294 %u2013 %u2013 %u2013 (100.0)Venues and facilities 89 213 514 787 787 374 323 361 381 (13.6)Interest and rent on land %u2013 2 %u2013 %u2013 %u2013 %u2013 %u2013 %u2013 %u2013Interest (Incl. interest on unitary payments (PPP)) %u2013 2 %u2013 %u2013 %u2013 %u2013 %u2013 %u2013 %u2013Rent on land %u2013 %u2013 %u2013 %u2013 %u2013 %u2013 %u2013 %u2013 %u2013Transfers and subsidies %u2013 %u2013 %u2013 %u2013 %u2013 %u2013 %u2013 %u2013 %u2013Provinces and municipalities %u2013 %u2013 %u2013 %u2013 %u2013 %u2013 %u2013 %u2013 %u2013Provinces %u2013 %u2013 %u2013 %u2013 %u2013 %u2013 %u2013 %u2013 %u2013Provincial Revenue Funds %u2013 %u2013 %u2013 %u2013 %u2013 %u2013 %u2013 %u2013 %u2013Provincial agencies and funds %u2013 %u2013 %u2013 %u2013 %u2013 %u2013 %u2013 %u2013 %u2013Municipalities %u2013 %u2013 %u2013 %u2013 %u2013 %u2013 %u2013 %u2013 %u2013Municipal bank accounts %u2013 %u2013 %u2013 %u2013 %u2013 %u2013 %u2013 %u2013 %u2013Municipal agencies and funds %u2013 %u2013 %u2013 %u2013 %u2013 %u2013 %u2013 %u2013 %u2013Departmental agencies and accounts %u2013 %u2013 %u2013 %u2013 %u2013 %u2013 %u2013 %u2013 %u2013Social security funds %u2013 %u2013 %u2013 %u2013 %u2013 %u2013 %u2013 %u2013 %u2013Departmental agencies (non-business entities) %u2013 %u2013 %u2013 %u2013 %u2013 %u2013 %u2013 %u2013 %u2013Higher education institutions %u2013 %u2013 %u2013 %u2013 %u2013 %u2013 %u2013 %u2013 %u2013Foreign governments and international organisations %u2013 %u2013 %u2013 %u2013 %u2013 %u2013 %u2013 %u2013 %u2013Public corporations and private enterprises %u2013 %u2013 %u2013 %u2013 %u2013 %u2013 %u2013 %u2013 %u2013Public corporations %u2013 %u2013 %u2013 %u2013 %u2013 %u2013 %u2013 %u2013 %u2013Subsidies on products and production (pc) %u2013 %u2013 %u2013 %u2013 %u2013 %u2013 %u2013 %u2013 %u2013Other transfers to public corporations %u2013 %u2013 %u2013 %u2013 %u2013 %u2013 %u2013 %u2013 %u2013Private enterprises %u2013 %u2013 %u2013 %u2013 %u2013 %u2013 %u2013 %u2013 %u2013Subsidies on products and production (pe) %u2013 %u2013 %u2013 %u2013 %u2013 %u2013 %u2013 %u2013 %u2013Other transfers to private enterprises %u2013 %u2013 %u2013 %u2013 %u2013 %u2013 %u2013 %u2013 %u2013Non-profit institutions %u2013 %u2013 %u2013 %u2013 %u2013 %u2013 %u2013 %u2013 %u2013Households %u2013 %u2013 %u2013 %u2013 %u2013 %u2013 %u2013 %u2013 %u2013Social benefits %u2013 %u2013 %u2013 %u2013 %u2013 %u2013 %u2013 %u2013 %u2013Other transfers to households %u2013 %u2013 %u2013 %u2013 %u2013 %u2013 %u2013 %u2013 %u2013Payments for capital assets 2 560 2 653 2 592 %u2013 1 825 1 347 %u2013 %u2013 %u2013 (100.0)Buildings and other fixed structures 2 560 2 653 2 337 %u2013 1 825 1 347 %u2013 %u2013 %u2013 (100.0)Buildings 2 560 2 653 2 337 %u2013 1 825 1 347 %u2013 %u2013 %u2013 (100.0)Other fixed structures %u2013 %u2013 %u2013 %u2013 %u2013 %u2013 %u2013 %u2013 %u2013Machinery and equipment %u2013 %u2013 255 %u2013 %u2013 %u2013 %u2013 %u2013 %u2013Transport equipment %u2013 %u2013 %u2013 %u2013 %u2013 %u2013 %u2013 %u2013 %u2013Other machinery and equipment %u2013 %u2013 255 %u2013 %u2013 %u2013 %u2013 %u2013 %u2013Heritage Assets %u2013 %u2013 %u2013 %u2013 %u2013 %u2013 %u2013 %u2013 %u2013Specialised military assets %u2013 %u2013 %u2013 %u2013 %u2013 %u2013 %u2013 %u2013 %u2013Biological assets %u2013 %u2013 %u2013 %u2013 %u2013 %u2013 %u2013 %u2013 %u2013Land and sub-soil assets %u2013 %u2013 %u2013 %u2013 %u2013 %u2013 %u2013 %u2013 %u2013Software and other intangible assets %u2013 %u2013 %u2013 %u2013 %u2013 %u2013 %u2013 %u2013 %u2013Payments for financial assets %u2013 %u2013 %u2013 %u2013 %u2013 %u2013 %u2013 %u2013 %u2013Total economic classification 150 958 130 633 144 904 159 609 169 018 153 391 151 356 136 415 140 557 (1.3)2024/25318
