
Page 336 - Demo
P. 336
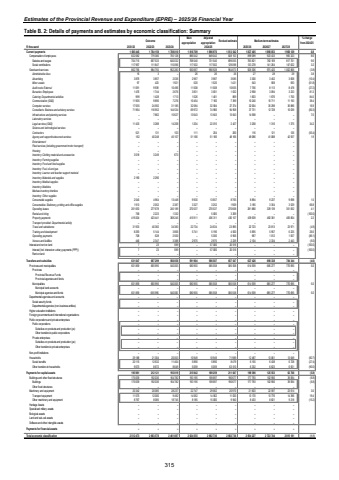
Estimates of the Provincial Revenue and Expenditure (EPRE) %u2013 2025/26 Financial YearTable B. 2: Details of payments and estimates by economic classification: Summary Outcome Main appropriationAdjusted appropriation Revised estimate Medium-term estimates % change from 2024/25R thousand 2021/22 2022/23 2023/24 2025/26 2026/27 2027/28Current payments 1 764 158 1 685 445 1 708 010 1 816 709 1 896 970 1 813 542 1 827 405 1 898 853 1 968 129 0.8Compensation of employees 822 682 779 380 755 128 886 042 849 042 828 153 899 099 923 433 965 323 8.6Salaries and wages 704 715 667 533 640 032 768 540 731 540 699 055 765 821 782 169 817 701 9.6Social contributions 117 967 111 847 115 096 117 502 117 502 129 098 133 278 141 264 147 622 3.2Goods and services 862 756 984 755 952 283 930 667 990 928 964 873 928 306 975 420 1 002 806 (3.8)Administrative fees 3 16 %u2013 26 26 26 27 28 29 3.8Advertising 3 857 3 876 2 036 2 967 3 987 3 685 3 300 3 452 3 608 (10.4)Minor assets 423 97 1 921 520 1 520 1 421 543 568 593 (61.8)Audit costs: External 9 939 11 091 10 496 11 508 11 508 10 655 7 756 8 113 8 478 (27.2)Bursaries: Employees 1 476 1 744 2 676 3 831 3 831 1 632 2 958 3 094 3 233 81.3Catering: Departmental activities 999 1 428 1 713 1 526 1 401 869 1 603 1 676 1 750 84.5Communication (G&S) 11 905 9 890 7 276 10 454 7 160 7 399 10 240 10 711 11 193 38.4Computer services 17 055 24 592 31 185 32 584 32 584 27 374 32 004 35 298 36 886 16.9Consultants: Business and advisory services 71 964 116 952 144 534 69 972 74 966 94 958 37 731 12 728 10 039 (60.3)Infrastructure and planning services %u2013 7 862 15 627 13 643 13 643 13 643 14 598 %u2013 %u2013 7.0Laboratory services %u2013 %u2013 %u2013 %u2013 %u2013 %u2013 %u2013 %u2013 %u2013Legal services (G&S) 11 433 3 288 14 208 1 204 22 015 2 427 3 258 1 316 1 375 34.2Science and technological services %u2013 %u2013 %u2013 %u2013 %u2013 %u2013 %u2013 %u2013 %u2013Contractors 521 131 103 111 254 260 116 121 126 (55.4)Agency and support/outsourced services 162 40 248 45 107 51 166 51 166 48 166 49 086 41 088 42 937 1.9Entertainment %u2013 %u2013 %u2013 %u2013 %u2013 %u2013 %u2013 %u2013 %u2013Fleet services (including government motor transport) %u2013 %u2013 %u2013 %u2013 %u2013 %u2013 %u2013 %u2013 %u2013Housing %u2013 %u2013 %u2013 %u2013 %u2013 %u2013 %u2013 %u2013 %u2013Inventory: Clothing material and accessories 3 018 3 249 673 %u2013 %u2013 %u2013 %u2013 %u2013 %u2013Inventory: Farming supplies %u2013 %u2013 %u2013 %u2013 %u2013 %u2013 %u2013 %u2013 %u2013Inventory: Food and food supplies %u2013 %u2013 %u2013 %u2013 %u2013 %u2013 %u2013 %u2013 %u2013Inventory: Fuel, oil and gas %u2013 %u2013 %u2013 %u2013 %u2013 %u2013 %u2013 %u2013 %u2013Inventory: Learner and teacher support material %u2013 %u2013 %u2013 %u2013 %u2013 %u2013 %u2013 %u2013 %u2013Inventory: Materials and supplies 2 190 2 290 %u2013 %u2013 %u2013 %u2013 %u2013 %u2013 %u2013Inventory: Medical supplies %u2013 %u2013 %u2013 %u2013 %u2013 %u2013 %u2013 %u2013 %u2013Inventory: Medicine %u2013 %u2013 %u2013 %u2013 %u2013 %u2013 %u2013 %u2013 %u2013Medsas inventory interface %u2013 %u2013 %u2013 %u2013 %u2013 %u2013 %u2013 %u2013 %u2013Inventory: Other supplies %u2013 %u2013 %u2013 %u2013 %u2013 %u2013 %u2013 %u2013 %u2013Consumable supplies 2 045 4 964 13 448 9 930 13 657 8 765 8 894 9 237 9 698 1.5Consumables: Stationery, printing and office supplies 1 913 2 052 2 387 3 327 3 252 1 909 3 185 3 354 3 529 66.8Operating leases 261 653 277 678 245 189 270 537 270 537 270 668 281 880 329 139 351 832 4.1Rental and hiring 758 2 223 1 332 %u2013 5 005 3 269 %u2013 %u2013 %u2013 (100.0)Property payments 419 204 423 441 368 245 415 911 436 311 430 157 439 639 482 381 483 804 2.2Transport provided: Departmental activity %u2013 %u2013 %u2013 %u2013 %u2013 %u2013 %u2013 %u2013 %u2013Travel and subsistence 31 933 40 382 34 383 22 734 24 634 23 895 22 723 23 813 23 971 (4.9)Training and development 8 293 5 144 3 806 5 741 5 196 4 500 5 695 5 957 6 225 26.6Operating payments 708 628 2 550 %u2013 5 300 6 956 967 1 012 1 057 (86.1)Venues and facilities 446 2 347 3 388 2 975 2 975 2 239 2 104 2 334 2 443 (6.0)Interest and rent on land 7 23 599 %u2013 57 000 20 516 %u2013 %u2013 %u2013 (100.0)Interest (Incl. interest on unitary payments (PPP)) 7 23 599 %u2013 57 000 20 516 %u2013 %u2013 %u2013 (100.0)Rent on land %u2013 %u2013 %u2013 %u2013 %u2013 %u2013 %u2013 %u2013 %u2013Transfers and subsidies 631 047 687 299 560 058 591 904 596 507 657 547 627 426 698 338 784 344 (4.6)Provinces and municipalities 601 859 665 995 540 005 580 955 585 558 585 558 614 939 685 277 770 695 5.0Provinces %u2013 %u2013 %u2013 %u2013 %u2013 %u2013 %u2013 %u2013 %u2013Provincial Revenue Funds %u2013 %u2013 %u2013 %u2013 %u2013 %u2013 %u2013 %u2013 %u2013Provincial agencies and funds %u2013 %u2013 %u2013 %u2013 %u2013 %u2013 %u2013 %u2013 %u2013Municipalities 601 859 665 995 540 005 580 955 585 558 585 558 614 939 685 277 770 695 5.0Municipal bank accounts %u2013 %u2013 %u2013 %u2013 %u2013 %u2013 %u2013 %u2013 %u2013Municipal agencies and funds 601 859 665 995 540 005 580 955 585 558 585 558 614 939 685 277 770 695 5.0Departmental agencies and accounts %u2013 %u2013 %u2013 %u2013 %u2013 %u2013 %u2013 %u2013 %u2013Social security funds %u2013 %u2013 %u2013 %u2013 %u2013 %u2013 %u2013 %u2013 %u2013Departmental agencies (non-business entities) %u2013 %u2013 %u2013 %u2013 %u2013 %u2013 %u2013 %u2013 %u2013Higher education institutions %u2013 %u2013 %u2013 %u2013 %u2013 %u2013 %u2013 %u2013 %u2013Foreign governments and international organisations %u2013 %u2013 %u2013 %u2013 %u2013 %u2013 %u2013 %u2013 %u2013Public corporations and private enterprises %u2013 %u2013 %u2013 %u2013 %u2013 %u2013 %u2013 %u2013 %u2013Public corporations %u2013 %u2013 %u2013 %u2013 %u2013 %u2013 %u2013 %u2013 %u2013Subsidies on products and production (pc) %u2013 %u2013 %u2013 %u2013 %u2013 %u2013 %u2013 %u2013 %u2013Other transfers to public corporations %u2013 %u2013 %u2013 %u2013 %u2013 %u2013 %u2013 %u2013 %u2013Private enterprises %u2013 %u2013 %u2013 %u2013 %u2013 %u2013 %u2013 %u2013 %u2013Subsidies on products and production (pe) %u2013 %u2013 %u2013 %u2013 %u2013 %u2013 %u2013 %u2013 %u2013Other transfers to private enterprises %u2013 %u2013 %u2013 %u2013 %u2013 %u2013 %u2013 %u2013 %u2013Non-profit institutions %u2013 %u2013 %u2013 %u2013 %u2013 %u2013 %u2013 %u2013 %u2013Households 29 188 21 304 20 053 10 949 10 949 71 989 12 487 13 061 13 649 (82.7)Social benefits 20 115 12 632 11 404 5 890 5 890 8 479 6 155 6 438 6 728 (27.4)Other transfers to households 9 073 8 672 8 649 5 059 5 059 63 510 6 332 6 623 6 921 (90.0)Payments for capital assets 195 981 212 121 193 019 215 942 189 259 211 647 199 396 125 553 62 708 (5.8)Buildings and other fixed structures 175 639 192 036 164 782 193 195 159 697 190 677 177 793 102 956 39 094 (6.8)Buildings 175 639 192 036 164 782 193 195 159 697 190 677 177 793 102 956 39 094 (6.8)Other fixed structures %u2013 %u2013 %u2013 %u2013 %u2013 %u2013 %u2013 %u2013 %u2013Machinery and equipment 20 342 20 085 28 237 22 747 29 562 20 970 21 603 22 597 23 614 3.0Transport equipment 11 575 12 000 9 492 14 562 14 562 11 030 13 170 13 776 14 396 19.4Other machinery and equipment 8 767 8 085 18 745 8 185 15 000 9 940 8 433 8 821 9 218 (15.2)Heritage Assets %u2013 %u2013 %u2013 %u2013 %u2013 %u2013 %u2013 %u2013 %u2013Specialised military assets %u2013 %u2013 %u2013 %u2013 %u2013 %u2013 %u2013 %u2013 %u2013Biological assets %u2013 %u2013 %u2013 %u2013 %u2013 %u2013 %u2013 %u2013 %u2013Land and sub-soil assets %u2013 %u2013 %u2013 %u2013 %u2013 %u2013 %u2013 %u2013 %u2013Software and other intangible assets %u2013 %u2013 %u2013 %u2013 %u2013 %u2013 %u2013 %u2013 %u2013Payments for financial assets %u2013 %u2013 %u2013 %u2013 %u2013 %u2013 %u2013 %u2013 %u2013Total economic classification 2 512 473 2 663 578 2 461 087 2 624 555 2 682 736 2 682 736 2 654 227 2 722 744 2 815 181 (1.1)2024/25315
