
Page 338 - Demo
P. 338
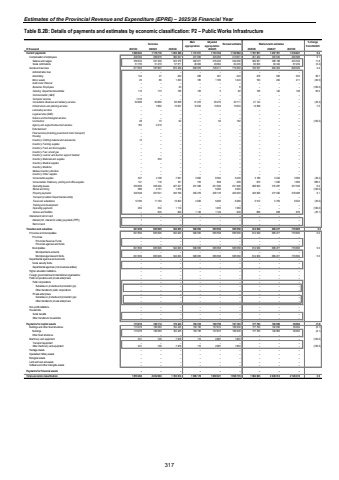
Estimates of the Provincial Revenue and Expenditure (EPRE) %u2013 2025/26 Financial YearTable B.2B: Details of payments and estimates by economic classification: P2 %u2013 Public Works Infrastructure Outcome Main appropriationAdjusted appropriation Revised estimate Medium-term estimates % change from 2024/25R thousand 2021/22 2022/23 2023/24 2025/26 2026/27 2027/28Current payments 1 176 776 1 080 023 1 053 386 1 131 911 1 153 704 1 132 994 1 191 951 1 257 781 1 318 627 5.2Compensation of employees 408 369 388 879 380 947 431 935 425 293 413 601 451 404 453 532 490 588 9.1Salaries and wages 356 634 337 409 323 376 382 871 376 229 349 256 390 561 389 188 423 349 11.8Social contributions 51 735 51 470 57 571 49 064 49 064 64 345 60 843 64 344 67 239 (5.4)Goods and services 671 653 787 897 672 439 699 976 728 411 719 393 740 547 804 249 828 039 2.9Administrative fees %u2013 %u2013 %u2013 %u2013 %u2013 %u2013 %u2013 %u2013 %u2013Advertising 144 27 220 266 391 243 478 500 523 96.7Minor assets 25 89 1 253 185 1 185 1 243 193 202 211 (84.5)Audit costs: External %u2013 %u2013 %u2013 %u2013 %u2013 %u2013 %u2013 %u2013 %u2013Bursaries: Employees %u2013 %u2013 43 %u2013 %u2013 6 %u2013 %u2013 %u2013 (100.0)Catering: Departmental activities 115 173 156 130 5 82 136 142 148 65.9Communication (G&S) %u2013 %u2013 %u2013 %u2013 %u2013 %u2013 %u2013 %u2013 %u2013Computer services 1 419 %u2013 %u2013 %u2013 %u2013 %u2013 %u2013 %u2013 %u2013Consultants: Business and advisory services 63 908 93 860 60 838 31 270 35 270 32 711 21 144 %u2013 %u2013 (35.4)Infrastructure and planning services %u2013 7 862 15 627 13 643 13 643 13 643 14 598 %u2013 %u2013 7.0Laboratory services %u2013 %u2013 %u2013 %u2013 %u2013 %u2013 %u2013 %u2013 %u2013Legal services (G&S) %u2013 %u2013 %u2013 %u2013 %u2013 %u2013 %u2013 %u2013 %u2013Science and technological services %u2013 %u2013 %u2013 %u2013 %u2013 %u2013 %u2013 %u2013 %u2013Contractors 28 73 92 %u2013 93 162 %u2013 %u2013 %u2013 (100.0)Agency and support/outsourced services 162 2 410 %u2013 %u2013 %u2013 %u2013 %u2013 %u2013 %u2013Entertainment %u2013 %u2013 %u2013 %u2013 %u2013 %u2013 %u2013 %u2013 %u2013Fleet services (including government motor transport) %u2013 %u2013 %u2013 %u2013 %u2013 %u2013 %u2013 %u2013 %u2013Housing %u2013 %u2013 %u2013 %u2013 %u2013 %u2013 %u2013 %u2013 %u2013Inventory: Clothing material and accessories 12 %u2013 %u2013 %u2013 %u2013 %u2013 %u2013 %u2013 %u2013Inventory: Farming supplies %u2013 %u2013 %u2013 %u2013 %u2013 %u2013 %u2013 %u2013 %u2013Inventory: Food and food supplies %u2013 %u2013 %u2013 %u2013 %u2013 %u2013 %u2013 %u2013 %u2013Inventory: Fuel, oil and gas %u2013 %u2013 %u2013 %u2013 %u2013 %u2013 %u2013 %u2013 %u2013Inventory: Learner and teacher support material %u2013 %u2013 %u2013 %u2013 %u2013 %u2013 %u2013 %u2013 %u2013Inventory: Materials and supplies %u2013 453 %u2013 %u2013 %u2013 %u2013 %u2013 %u2013 %u2013Inventory: Medical supplies %u2013 %u2013 %u2013 %u2013 %u2013 %u2013 %u2013 %u2013 %u2013Inventory: Medicine %u2013 %u2013 %u2013 %u2013 %u2013 %u2013 %u2013 %u2013 %u2013Medsas inventory interface %u2013 %u2013 %u2013 %u2013 %u2013 %u2013 %u2013 %u2013 %u2013Inventory: Other supplies %u2013 %u2013 %u2013 %u2013 %u2013 %u2013 %u2013 %u2013 %u2013Consumable supplies 527 4 108 7 091 3 802 6 584 5 249 3 189 3 224 3 369 (39.2)Consumables: Stationery, printing and office supplies 121 116 161 733 658 209 975 1 020 1 066 366.5Operating leases 250 909 256 492 227 227 251 396 251 396 251 396 268 620 315 267 337 336 6.9Rental and hiring 686 2 151 1 079 %u2013 5 000 3 264 %u2013 %u2013 %u2013 (100.0)Property payments 340 548 407 641 345 799 392 476 406 176 400 393 425 006 477 292 478 486 6.1Transport provided: Departmental activity %u2013 %u2013 %u2013 %u2013 %u2013 %u2013 %u2013 %u2013 %u2013Travel and subsistence 12 785 11 163 10 823 4 926 5 826 8 480 5 512 5 764 6 024 (35.0)Training and development %u2013 %u2013 %u2013 %u2013 %u2013 %u2013 %u2013 %u2013 %u2013Operating payments 264 334 1 110 %u2013 1 035 1 383 %u2013 %u2013 %u2013 (100.0)Venues and facilities %u2013 945 920 1 149 1 149 929 696 838 876 (25.1)Interest and rent on land 1 %u2013 %u2013 %u2013 %u2013 %u2013 %u2013 %u2013 %u2013Interest (Incl. interest on unitary payments (PPP)) 1 %u2013 %u2013 %u2013 %u2013 %u2013 %u2013 %u2013 %u2013Rent on land %u2013 %u2013 %u2013 %u2013 %u2013 %u2013 %u2013 %u2013 %u2013Transfers and subsidies 601 859 665 995 540 005 580 955 585 558 585 558 614 939 685 277 770 695 5.0 Provinces and municipalities 601 859 665 995 540 005 580 955 585 558 585 558 614 939 685 277 770 695 5.0Provinces %u2013 %u2013 %u2013 %u2013 %u2013 %u2013 %u2013 %u2013 %u2013Provincial Revenue Funds %u2013 %u2013 %u2013 %u2013 %u2013 %u2013 %u2013 %u2013 %u2013Provincial agencies and funds %u2013 %u2013 %u2013 %u2013 %u2013 %u2013 %u2013 %u2013 %u2013Municipalities 601 859 665 995 540 005 580 955 585 558 585 558 614 939 685 277 770 695 5.0Municipal bank accounts %u2013 %u2013 %u2013 %u2013 %u2013 %u2013 %u2013 %u2013 %u2013Municipal agencies and funds 601 859 665 995 540 005 580 955 585 558 585 558 614 939 685 277 770 695 5.0Departmental agencies and accounts %u2013 %u2013 %u2013 %u2013 %u2013 %u2013 %u2013 %u2013 %u2013Social security funds %u2013 %u2013 %u2013 %u2013 %u2013 %u2013 %u2013 %u2013 %u2013Departmental agencies (non-business entities) %u2013 %u2013 %u2013 %u2013 %u2013 %u2013 %u2013 %u2013 %u2013Higher education institutions %u2013 %u2013 %u2013 %u2013 %u2013 %u2013 %u2013 %u2013 %u2013Foreign governments and international organisations %u2013 %u2013 %u2013 %u2013 %u2013 %u2013 %u2013 %u2013 %u2013Public corporations and private enterprises %u2013 %u2013 %u2013 %u2013 %u2013 %u2013 %u2013 %u2013 %u2013Public corporations %u2013 %u2013 %u2013 %u2013 %u2013 %u2013 %u2013 %u2013 %u2013Subsidies on products and production (pc) %u2013 %u2013 %u2013 %u2013 %u2013 %u2013 %u2013 %u2013 %u2013Other transfers to public corporations %u2013 %u2013 %u2013 %u2013 %u2013 %u2013 %u2013 %u2013 %u2013Private enterprises %u2013 %u2013 %u2013 %u2013 %u2013 %u2013 %u2013 %u2013 %u2013Subsidies on products and production (pe) %u2013 %u2013 %u2013 %u2013 %u2013 %u2013 %u2013 %u2013 %u2013Other transfers to private enterprises %u2013 %u2013 %u2013 %u2013 %u2013 %u2013 %u2013 %u2013 %u2013Non-profit institutions %u2013 %u2013 %u2013 %u2013 %u2013 %u2013 %u2013 %u2013 %u2013Households %u2013 %u2013 %u2013 %u2013 %u2013 %u2013 %u2013 %u2013 %u2013Social benefits %u2013 %u2013 %u2013 %u2013 %u2013 %u2013 %u2013 %u2013 %u2013Other transfers to households %u2013 %u2013 %u2013 %u2013 %u2013 %u2013 %u2013 %u2013 %u2013Payments for capital assets 173 610 190 112 170 423 193 310 160 759 191 183 177 793 102 956 39 094 (7.0)Buildings and other fixed structures 173 079 189 383 162 445 193 195 157 872 189 330 177 793 102 956 39 094 (6.1)Buildings 173 079 189 383 162 445 193 195 157 872 189 330 177 793 102 956 39 094 (6.1)Other fixed structures %u2013 %u2013 %u2013 %u2013 %u2013 %u2013 %u2013 %u2013 %u2013Machinery and equipment 531 729 7 978 115 2 887 1 853 %u2013 %u2013 %u2013 (100.0)Transport equipment %u2013 %u2013 %u2013 %u2013 %u2013 %u2013 %u2013 %u2013 %u2013Other machinery and equipment 531 729 7 978 115 2 887 1 853 %u2013 %u2013 %u2013 (100.0)Heritage Assets %u2013 %u2013 %u2013 %u2013 %u2013 %u2013 %u2013 %u2013 %u2013Specialised military assets %u2013 %u2013 %u2013 %u2013 %u2013 %u2013 %u2013 %u2013 %u2013Biological assets %u2013 %u2013 %u2013 %u2013 %u2013 %u2013 %u2013 %u2013 %u2013Land and sub-soil assets %u2013 %u2013 %u2013 %u2013 %u2013 %u2013 %u2013 %u2013 %u2013Software and other intangible assets %u2013 %u2013 %u2013 %u2013 %u2013 %u2013 %u2013 %u2013 %u2013Payments for financial assets %u2013 %u2013 %u2013 %u2013 %u2013 %u2013 %u2013 %u2013 %u2013Total economic classification 1 855 492 2 032 883 1 763 814 1 906 176 1 900 021 1 909 735 1 984 683 2 046 014 2 128 416 3.92024/25317
