
Page 335 - Demo
P. 335
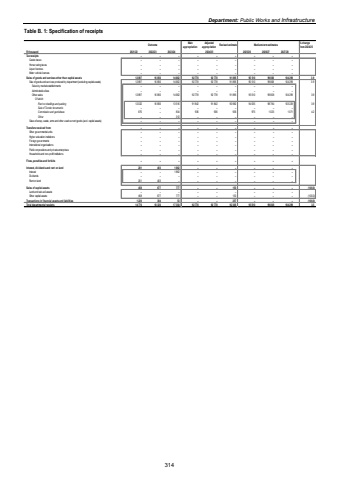
Department: Public Works and InfrastructureTable B. 1: Specification of receipts Outcome Main appropriationAdjusted appropriation Revised estimate Medium-term estimates % change from 2024/25R thousand 2021/22 2022/23 2023/24 2025/26 2026/27 2027/28Tax receipts %u2013 %u2013 %u2013 %u2013 %u2013 %u2013 %u2013 %u2013 %u2013 Casino taxes %u2013 %u2013 %u2013 %u2013 %u2013 %u2013 %u2013 %u2013 %u2013 Horse racing taxes %u2013 %u2013 %u2013 %u2013 %u2013 %u2013 %u2013 %u2013 %u2013 Liquor licences %u2013 %u2013 %u2013 %u2013 %u2013 %u2013 %u2013 %u2013 %u2013 Motor vehicle licences %u2013 %u2013 %u2013 %u2013 %u2013 %u2013 %u2013 %u2013 %u2013 Sales of goods and services other than capital assets 12 897 16 856 14 662 92 778 92 778 91 895 95 510 99 808 104 299 3.9Sale of goods and services produced by department (excluding capital assets) 12 897 16 856 14 662 92 778 92 778 91 895 95 510 99 808 104 299 3.9Sales by market establishments %u2013 %u2013 %u2013 %u2013 %u2013 %u2013 %u2013 %u2013 %u2013 Administrative fees %u2013 %u2013 %u2013 %u2013 %u2013 %u2013 %u2013 %u2013 %u2013Other sales 12 897 16 856 14 662 92 778 92 778 91 895 95 510 99 808 104 299 3.9Of whichRent on dwellings and packing 12 022 16 856 13 516 91 842 91 842 90 982 94 535 98 784 103 229 3.9Sale of Tender documents %u2013 %u2013 %u2013 %u2013 %u2013 %u2013 %u2013 %u2013 %u2013Commission and garnishees 875 %u2013 834 936 936 936 975 1 025 1 071 4.2Other %u2013 %u2013 312 %u2013 %u2013 %u2013 %u2013 %u2013 %u2013Sales of scrap, waste, arms and other used current goods (excl. capital assets) %u2013 %u2013 %u2013 %u2013 %u2013 %u2013 %u2013 %u2013 %u2013Transfers received from: %u2013 %u2013 %u2013 %u2013 %u2013 %u2013 %u2013 %u2013 %u2013Other governmental units %u2013 %u2013 %u2013 %u2013 %u2013 %u2013 %u2013 %u2013 %u2013Higher education institutions %u2013 %u2013 %u2013 %u2013 %u2013 %u2013 %u2013 %u2013 %u2013Foreign governments %u2013 %u2013 %u2013 %u2013 %u2013 %u2013 %u2013 %u2013 %u2013International organisations %u2013 %u2013 %u2013 %u2013 %u2013 %u2013 %u2013 %u2013 %u2013Public corporations and private enterprises %u2013 %u2013 %u2013 %u2013 %u2013 %u2013 %u2013 %u2013 %u2013Households and non-profit institutions %u2013 %u2013 %u2013 %u2013 %u2013 %u2013 %u2013 %u2013 %u2013Fines, penalties and forfeits %u2013 %u2013 %u2013 %u2013 %u2013 %u2013 %u2013 %u2013 %u2013Interest, dividends and rent on land 201 403 1 862 %u2013 %u2013 %u2013 %u2013 %u2013 %u2013Interest %u2013 %u2013 1 862 %u2013 %u2013 %u2013 %u2013 %u2013 %u2013Dividends %u2013 %u2013 %u2013 %u2013 %u2013 %u2013 %u2013 %u2013 %u2013Rent on land 201 403 %u2013 %u2013 %u2013 %u2013 %u2013 %u2013 %u2013Sales of capital assets 458 677 777 %u2013 %u2013 153 %u2013 %u2013 %u2013 (100.0)Land and sub-soil assets %u2013 %u2013 %u2013 %u2013 %u2013 %u2013 %u2013 %u2013 %u2013Other capital assets 458 677 777 %u2013 %u2013 153 %u2013 %u2013 %u2013 (100.0)Transactions in financial assets and liabilities 1 220 384 53 %u2013 %u2013 257 %u2013 %u2013 %u2013 (100.0)Total departmental receipts 14 776 18 320 17 354 92 778 92 778 92 305 95 510 99 808 104 299 3.52024/25314
