
Page 337 - Demo
P. 337
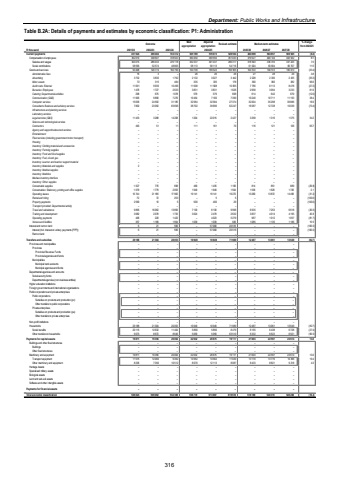
Department: Public Works and InfrastructureTable B.2A: Details of payments and estimates by economic classification: P1: Administration Outcome Main appropriationAdjusted appropriation Revised estimate Medium-term estimates % change from 2024/25R thousand 2021/22 2022/23 2023/24 2025/26 2026/27 2027/28Current payments 459 402 457 024 512 312 525 189 576 073 528 504 484 099 504 657 508 945 (8.4)Compensation of employees 362 610 338 607 318 923 390 450 359 550 351 033 379 527 400 144 403 932 8.1Salaries and wages 304 015 286 033 270 118 332 337 301 437 296 317 318 503 336 310 337 225 7.5Social contributions 58 595 52 574 48 805 58 113 58 113 54 716 61 024 63 834 66 707 11.5Goods and services 94 408 120 774 192 790 134 739 159 523 156 955 104 572 104 513 105 013 (33.4)Administrative fees 3 16 %u2013 26 26 26 27 28 29 3.8Advertising 3 830 3 732 1 792 2 132 3 027 3 442 2 228 2 330 2 435 (35.3)Minor assets 315 72 484 335 335 178 350 366 382 96.6Audit costs: External 9 939 11 091 10 496 11 508 11 508 10 655 7 756 8 113 8 478 (27.2)Bursaries: Employees 1 476 1 727 2 633 3 831 3 831 1 626 2 958 3 094 3 233 81.9Catering: Departmental activities 298 675 1 078 579 579 698 614 642 670 (12.0)Communication (G&S) 11 905 9 890 7 276 10 454 7 160 7 399 10 240 10 711 11 193 38.4Computer services 15 636 24 592 31 185 32 584 32 584 27 374 32 004 35 298 36 886 16.9Consultants: Business and advisory services 7 802 23 092 83 696 38 702 39 696 62 247 16 587 12 728 10 039 (73.4)Infrastructure and planning services %u2013 %u2013 %u2013 %u2013 %u2013 %u2013 %u2013 %u2013 %u2013Laboratory services %u2013 %u2013 %u2013 %u2013 %u2013 %u2013 %u2013 %u2013 %u2013Legal services (G&S) 11 433 3 288 14 208 1 204 22 015 2 427 3 258 1 316 1 375 34.2Science and technological services %u2013 %u2013 %u2013 %u2013 %u2013 %u2013 %u2013 %u2013 %u2013Contractors 493 51 11 111 161 70 116 121 126 65.7Agency and support/outsourced services %u2013 %u2013 %u2013 %u2013 %u2013 %u2013 %u2013 %u2013 %u2013Entertainment %u2013 %u2013 %u2013 %u2013 %u2013 %u2013 %u2013 %u2013 %u2013Fleet services (including government motor transport) %u2013 %u2013 %u2013 %u2013 %u2013 %u2013 %u2013 %u2013 %u2013Housing %u2013 %u2013 %u2013 %u2013 %u2013 %u2013 %u2013 %u2013 %u2013Inventory: Clothing material and accessories %u2013 %u2013 %u2013 %u2013 %u2013 %u2013 %u2013 %u2013 %u2013Inventory: Farming supplies %u2013 %u2013 %u2013 %u2013 %u2013 %u2013 %u2013 %u2013 %u2013Inventory: Food and food supplies %u2013 %u2013 %u2013 %u2013 %u2013 %u2013 %u2013 %u2013 %u2013Inventory: Fuel, oil and gas %u2013 %u2013 %u2013 %u2013 %u2013 %u2013 %u2013 %u2013 %u2013Inventory: Learner and teacher support material %u2013 %u2013 %u2013 %u2013 %u2013 %u2013 %u2013 %u2013 %u2013Inventory: Materials and supplies 2 %u2013 %u2013 %u2013 %u2013 %u2013 %u2013 %u2013 %u2013Inventory: Medical supplies %u2013 %u2013 %u2013 %u2013 %u2013 %u2013 %u2013 %u2013 %u2013Inventory: Medicine %u2013 %u2013 %u2013 %u2013 %u2013 %u2013 %u2013 %u2013 %u2013Medsas inventory interface %u2013 %u2013 %u2013 %u2013 %u2013 %u2013 %u2013 %u2013 %u2013Inventory: Other supplies %u2013 %u2013 %u2013 %u2013 %u2013 %u2013 %u2013 %u2013 %u2013Consumable supplies 1 027 776 698 490 1 435 1 160 814 851 889 (29.8)Consumables: Stationery, printing and office supplies 1 679 1 779 2 053 1 949 1 949 1 504 1 536 1 629 1 726 2.1Operating leases 10 744 21 186 17 962 19 141 19 141 19 272 13 260 13 872 14 496 (31.2)Rental and hiring 72 72 253 %u2013 5 5 %u2013 %u2013 %u2013 (100.0)Property payments 2 590 10 5 500 400 29 %u2013 %u2013 %u2013 (100.0)Transport provided: Departmental activity %u2013 %u2013 %u2013 %u2013 %u2013 %u2013 %u2013 %u2013 %u2013Travel and subsistence 9 895 16 062 13 850 7 130 8 130 9 996 6 935 7 253 6 618 (30.6)Training and development 3 682 2 078 1 733 3 024 2 479 2 632 3 837 4 014 4 195 45.8Operating payments 406 220 1 423 %u2013 4 023 5 279 967 1 012 1 057 (81.7)Venues and facilities 357 1 189 1 954 1 039 1 039 936 1 085 1 135 1 186 15.9Interest and rent on land 6 21 599 %u2013 57 000 20 516 %u2013 %u2013 %u2013 (100.0)Interest (Incl. interest on unitary payments (PPP)) 6 21 599 %u2013 57 000 20 516 %u2013 %u2013 %u2013 (100.0)Rent on land %u2013 %u2013 %u2013 %u2013 %u2013 %u2013 %u2013 %u2013 %u2013Transfers and subsidies 29 188 21 304 20 053 10 949 10 949 71 989 12 487 13 061 13 649 (82.7)Provinces and municipalities %u2013 %u2013 %u2013 %u2013 %u2013 %u2013 %u2013 %u2013 %u2013Provinces %u2013 %u2013 %u2013 %u2013 %u2013 %u2013 %u2013 %u2013 %u2013Provincial Revenue Funds %u2013 %u2013 %u2013 %u2013 %u2013 %u2013 %u2013 %u2013 %u2013Provincial agencies and funds %u2013 %u2013 %u2013 %u2013 %u2013 %u2013 %u2013 %u2013 %u2013Municipalities %u2013 %u2013 %u2013 %u2013 %u2013 %u2013 %u2013 %u2013 %u2013Municipal bank accounts %u2013 %u2013 %u2013 %u2013 %u2013 %u2013 %u2013 %u2013 %u2013Municipal agencies and funds %u2013 %u2013 %u2013 %u2013 %u2013 %u2013 %u2013 %u2013 %u2013Departmental agencies and accounts %u2013 %u2013 %u2013 %u2013 %u2013 %u2013 %u2013 %u2013 %u2013Social security funds %u2013 %u2013 %u2013 %u2013 %u2013 %u2013 %u2013 %u2013 %u2013Departmental agencies (non-business entities) %u2013 %u2013 %u2013 %u2013 %u2013 %u2013 %u2013 %u2013 %u2013Higher education institutions %u2013 %u2013 %u2013 %u2013 %u2013 %u2013 %u2013 %u2013 %u2013Foreign governments and international organisations %u2013 %u2013 %u2013 %u2013 %u2013 %u2013 %u2013 %u2013 %u2013Public corporations and private enterprises %u2013 %u2013 %u2013 %u2013 %u2013 %u2013 %u2013 %u2013 %u2013Public corporations %u2013 %u2013 %u2013 %u2013 %u2013 %u2013 %u2013 %u2013 %u2013Subsidies on products and production (pc) %u2013 %u2013 %u2013 %u2013 %u2013 %u2013 %u2013 %u2013 %u2013Other transfers to public corporations %u2013 %u2013 %u2013 %u2013 %u2013 %u2013 %u2013 %u2013 %u2013Private enterprises %u2013 %u2013 %u2013 %u2013 %u2013 %u2013 %u2013 %u2013 %u2013Subsidies on products and production (pe) %u2013 %u2013 %u2013 %u2013 %u2013 %u2013 %u2013 %u2013 %u2013Other transfers to private enterprises %u2013 %u2013 %u2013 %u2013 %u2013 %u2013 %u2013 %u2013 %u2013Non-profit institutions %u2013 %u2013 %u2013 %u2013 %u2013 %u2013 %u2013 %u2013 %u2013Households 29 188 21 304 20 053 10 949 10 949 71 989 12 487 13 061 13 649 (82.7)Social benefits 20 115 12 632 11 404 5 890 5 890 8 479 6 155 6 438 6 728 (27.4)Other transfers to households 9 073 8 672 8 649 5 059 5 059 63 510 6 332 6 623 6 921 (90.0)Payments for capital assets 19 811 19 356 20 004 22 632 26 675 19 117 21 603 22 597 23 614 13.0Buildings and other fixed structures %u2013 %u2013 %u2013 %u2013 %u2013 %u2013 %u2013 %u2013 %u2013Buildings %u2013 %u2013 %u2013 %u2013 %u2013 %u2013 %u2013 %u2013 %u2013Other fixed structures %u2013 %u2013 %u2013 %u2013 %u2013 %u2013 %u2013 %u2013 %u2013Machinery and equipment 19 811 19 356 20 004 22 632 26 675 19 117 21 603 22 597 23 614 13.0Transport equipment 11 575 12 000 9 492 14 562 14 562 11 030 13 170 13 776 14 396 19.4Other machinery and equipment 8 236 7 356 10 512 8 070 12 113 8 087 8 433 8 821 9 218 4.3Heritage Assets %u2013 %u2013 %u2013 %u2013 %u2013 %u2013 %u2013 %u2013 %u2013Specialised military assets %u2013 %u2013 %u2013 %u2013 %u2013 %u2013 %u2013 %u2013 %u2013Biological assets %u2013 %u2013 %u2013 %u2013 %u2013 %u2013 %u2013 %u2013 %u2013Land and sub-soil assets %u2013 %u2013 %u2013 %u2013 %u2013 %u2013 %u2013 %u2013 %u2013Software and other intangible assets %u2013 %u2013 %u2013 %u2013 %u2013 %u2013 %u2013 %u2013 %u2013Payments for financial assets %u2013 %u2013 %u2013 %u2013 %u2013 %u2013 %u2013 %u2013 %u2013Total economic classification 506 023 500 062 552 369 558 770 613 697 619 610 518 189 540 315 546 208 (16.4)2024/25316
