
Page 366 - Demo
P. 366
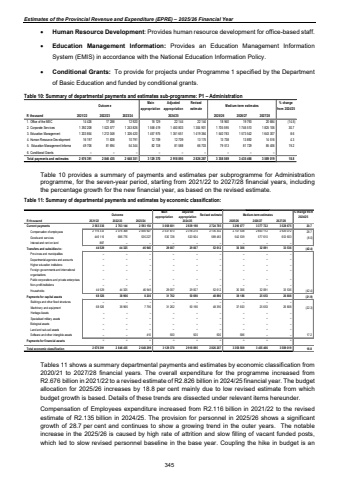
Estimates of the Provincial Revenue and Expenditure (EPRE) %u2013 2025/26 Financial Year%uf0b7 Human Resource Development: Provides human resource development for office-based staff. %uf0b7 Education Management Information: Provides an Education Management Information System (EMIS) in accordance with the National Education Information Policy. %uf0b7 Conditional Grants: To provide for projects under Programme 1 specified by the Department of Basic Education and funded by conditional grants. Table 10: Summary of departmental payments and estimates sub-programme: P1 %u2013 Administration OutcomeMain appropriationAdjusted appropriationRevised estimateMedium-term estimates % change from 2024/25R thousand 2021/22 2022/23 2023/24 2025/26 2026/27 2027/281. Office of the MEC 14 426 17 288 12 920 18 129 22 144 22 144 18 940 19 793 20 684 (14.5)2. Corporate Serv ices 1 392 208 1 523 577 1 243 826 1 558 419 1 450 803 1 304 901 1 705 595 1 746 510 1 825 106 30.73. Education Management 1 203 854 1 212 048 1 326 420 1 457 975 1 351 651 1 419 364 1 540 783 1 573 542 1 643 307 8.64. Human Resource Dev elopment 16 197 11 828 10 791 12 709 12 709 13 175 13 738 13 892 14 516 4.35. Education Management Informa 81 694 49 706 54 344 82 138 81 588 66 703 79 513 81 729 85 406 19.26. Conditional Grants %u2013 %u2013 %u2013 %u2013 %u2013 %u2013 %u2013 %u2013 %u2013 Total payments and estimates 2 676 391 2 846 435 2 648 301 3 129 370 2 918 895 2 826 287 3 358 569 3 435 466 3 589 019 18.82024/25 Table 10 provides a summary of payments and estimates per subprogramme for Administration programme, for the seven-year period, starting from 2021/22 to 2027/28 financial years, including the percentage growth for the new financial year, as based on the revised estimate. Table 11: Summary of departmental payments and estimates by economic classification: Outcome Main appropriationAdjusted appropriation Revised estimate Medium-term estimates % change from 2024/25R thousand 2021/22 2022/23 2023/24 2025/26 2026/27 2027/28Current payments 2 563 336 2 763 144 2 593 154 3 068 601 2 839 198 2 724 785 3 290 077 3 377 722 3 528 675 20.7Compensation of employees 2 116 333 2 076 368 2 056 927 2 537 873 2 318 274 2 135 302 2 747 538 2 800 112 2 925 072 28.7Goods and services 446 116 686 776 536 227 530 728 520 924 589 483 542 539 577 610 603 603 (8.0)Interest and rent on land 887 %u2013 %u2013 %u2013 %u2013 %u2013 %u2013 %u2013 %u2013Transfers and subsidies to: 44 529 44 325 46 945 29 007 29 007 52 612 30 306 32 091 33 536 (42.4)Provinces and municipalities %u2013 %u2013 %u2013 %u2013 %u2013 %u2013 %u2013 %u2013 %u2013Departmental agencies and accounts %u2013 %u2013 %u2013 %u2013 %u2013 %u2013 %u2013 %u2013 %u2013Higher education institutions %u2013 %u2013 %u2013 %u2013 %u2013 %u2013 %u2013 %u2013 %u2013Foreign governments and international organisations %u2013 %u2013 %u2013 %u2013 %u2013 %u2013 %u2013 %u2013 %u2013Public corporations and private enterprises %u2013 %u2013 %u2013 %u2013 %u2013 %u2013 %u2013 %u2013 %u2013Non-profit institutions %u2013 %u2013 %u2013 %u2013 %u2013 %u2013 %u2013 %u2013 %u2013Households 44 529 44 325 46 945 29 007 29 007 52 612 30 306 32 091 33 536 (42.4)Payments for capital assets 68 526 38 966 8 200 31 762 50 690 48 890 38 186 25 653 26 808 (21.9)Buildings and other fixed structures %u2013 %u2013 %u2013 %u2013 %u2013 %u2013 %u2013 %u2013 %u2013Machinery and equipment 68 526 38 966 7 790 31 262 50 190 48 390 37 600 25 653 26 808 (22.3)Heritage Assets %u2013 %u2013 %u2013 %u2013 %u2013 %u2013 %u2013 %u2013 %u2013Specialised military assets %u2013 %u2013 %u2013 %u2013 %u2013 %u2013 %u2013 %u2013 %u2013Biological assets %u2013 %u2013 %u2013 %u2013 %u2013 %u2013 %u2013 %u2013 %u2013Land and sub-soil assets %u2013 %u2013 %u2013 %u2013 %u2013 %u2013 %u2013 %u2013 %u2013Software and other intangible assets %u2013 %u2013 410 500 500 500 586 %u2013 %u2013 17.2Payments for financial assets %u2013 %u2013 %u2013 %u2013 %u2013 %u2013 %u2013 %u2013 %u2013Total economic classification 2 676 391 2 846 435 2 648 299 3 129 370 2 918 895 2 826 287 3 358 569 3 435 466 3 589 019 18.82024/25 Tables 11 shows a summary departmental payments and estimates by economic classification from 2020/21 to 2027/28 financial years. The overall expenditure for the programme increased from R2.676 billion in 2021/22 to a revised estimate of R2.826 billion in 2024/25 financial year. The budget allocation for 2025/26 increases by 18.8 per cent mainly due to low revised estimate from which budget growth is based. Details of these trends are dissected under relevant items hereunder. Compensation of Employees expenditure increased from R2.116 billion in 2021/22 to the revised estimate of R2.135 billion in 2024/25. The provision for personnel in 2025/26 shows a significant growth of 28.7 per cent and continues to show a growing trend in the outer years. The notable increase in the 2025/26 is caused by high rate of attrition and slow filling of vacant funded posts, which led to slow revised personnel baseline in the base year. Coupling the hike in budget is an 345
