
Page 384 - Demo
P. 384
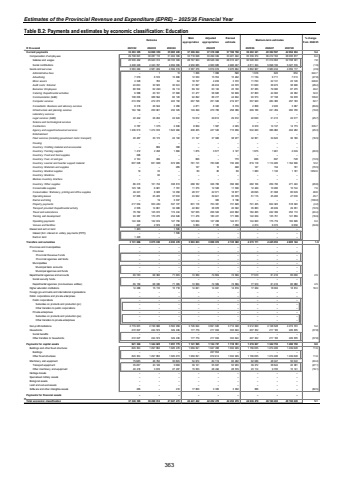
Estimates of the Provincial Revenue and Expenditure (EPRE) %u2013 2025/26 Financial YearTable B.2: Payments and estimates by economic classification: Education Outcome Main appropriationAdjusted appropriationRevised estimate Medium-term estimates % change from 2024/25R thousand 2021/22 2022/23 2023/24 2025/26 2026/27 2027/28Current payments 33 293 395 34 868 359 35 965 220 37 306 024 37 318 668 37 198 158 39 202 341 40 392 597 42 094 934 5.4Compensation of employ ees 29 708 691 30 287 110 31 404 395 33 718 648 33 499 049 33 221 494 35 339 374 36 412 163 38 035 817 6.4Salaries and w ages 25 500 462 25 943 313 26 745 300 28 767 963 28 548 364 28 315 447 30 528 050 31 314 063 32 708 301 7.8Social contributions 4 208 229 4 343 797 4 659 095 4 950 685 4 950 685 4 906 047 4 811 324 5 098 100 5 327 516 (1.9)Goods and serv ices 3 583 284 4 581 249 4 559 319 3 587 376 3 819 619 3 976 664 3 862 967 3 980 434 4 059 117 (2.9)Administrative fees 1 %u2013 13 1 256 1 066 590 1 916 622 654 224.7Advertising 8 516 7 079 10 896 12 530 15 762 15 462 11 159 6 711 7 013 (27.8)Minor assets 763 4 328 64 18 727 4 236 3 372 11 763 22 131 23 126 248.8Audit costs: External 24 204 30 522 30 324 31 897 48 434 44 570 31 900 36 972 38 636 (28.4)Bursaries: Employees 80 504 62 490 39 114 69 122 63 122 45 100 67 285 79 380 87 275 49.2Catering: Departmental activities 6 588 20 191 37 660 31 477 58 683 50 609 67 800 44 365 46 362 34.0Communication (G&S) 108 005 388 594 60 120 94 892 88 217 44 604 93 573 57 108 59 678 109.8Computer services 274 052 472 273 243 150 267 798 251 526 219 977 357 920 284 385 297 183 62.7Consultants: Business and advisory services 8 318 26 544 3 266 4 871 8 320 8 319 2 858 2 935 3 067 (65.6)Infrastructure and planning services 164 199 250 961 232 325 149 499 270 766 258 386 209 186 241 459 282 700 (19.0)Laboratory services %u2013 %u2013 %u2013 %u2013 %u2013 %u2013 %u2013 %u2013 %u2013Legal services (G&S) 22 442 26 204 24 643 19 612 29 612 29 612 22 000 21 413 22 377 (25.7)Science and technological services %u2013 %u2013 %u2013 %u2013 %u2013 %u2013 %u2013 %u2013 %u2013Contractors 2 787 1 375 2 636 8 829 1 567 2 045 8 910 14 137 14 773 335.7Agency and support/outsourced services 1 436 613 1 474 916 1 643 984 408 405 437 540 715 656 534 640 386 860 404 282 (25.3)Entertainment %u2013 %u2013 %u2013 %u2013 %u2013 %u2013 %u2013 %u2013 %u2013Fleet services (including government motor transport) 20 467 30 172 24 102 31 197 37 906 38 977 32 561 34 622 36 180 (16.5)Housing %u2013 %u2013 %u2013 %u2013 %u2013 %u2013 %u2013 %u2013 %u2013Inventory: Clothing material and accessories %u2013 669 368 %u2013 %u2013 %u2013 %u2013 %u2013 %u2013Inventory: Farming supplies 1 412 2 458 1 884 1 875 3 577 3 127 1 875 1 961 2 049 (40.0)Inventory: Food and food supplies 296 %u2013 %u2013 %u2013 %u2013 %u2013 %u2013 %u2013 %u2013Inventory: Fuel, oil and gas 2 134 499 %u2013 666 %u2013 770 666 697 728 (13.5)Inventory: Learner and teacher support material 607 028 651 968 674 965 781 741 783 626 730 238 819 118 1 114 485 1 164 636 12.2Inventory: Materials and supplies %u2013 %u2013 265 147 10 498 147 154 161 (70.5)Inventory: Medical supplies 19 33 %u2013 80 80 80 1 080 1 130 1 181 1250.0Inventory: Medicine %u2013 90 %u2013 %u2013 %u2013 %u2013 %u2013 %u2013 %u2013Medsas inventory interface %u2013 %u2013 %u2013 %u2013 %u2013 %u2013 %u2013 %u2013 %u2013Inventory: Other supplies 86 274 101 734 338 813 288 182 326 766 356 308 282 106 259 736 271 424 (20.8)Consumable supplies 123 126 6 981 7 761 11 375 12 526 11 536 12 449 10 280 10 744 7.9Consumables: Stationery, printing and office supplies 49 241 8 028 12 050 28 517 22 371 18 877 28 095 81 368 85 029 48.8Operating leases 37 665 25 225 37 530 43 642 39 941 35 078 51 115 45 483 47 530 45.7Rental and hiring %u2013 19 3 037 %u2013 300 5 196 %u2013 %u2013 (100.0) %u2013Property payments 217 054 553 484 537 727 801 174 703 381 731 828 701 435 624 923 518 022 (4.2)Transport provided: Departmental activity 2 505 14 861 32 088 42 662 38 878 40 092 35 883 46 939 49 051 (10.5)Travel and subsistence 78 764 125 915 174 434 197 035 256 522 243 682 184 265 242 336 253 113 (24.4)Training and development 93 387 170 270 234 646 111 476 180 431 171 006 142 029 135 751 141 859 (16.9)Operating payments 124 346 122 919 147 756 123 629 127 268 144 011 144 620 175 719 183 626 0.4Venues and facilities 447 2 574 3 698 5 063 7 185 7 058 4 613 6 372 6 658 (34.6)Interest and rent on land 1 420 1 506 %u2013 %u2013 %u2013 %u2013 %u2013 %u2013 %u2013Interest (Incl. interest on unitary pay ments (PPP)) %u2013 1 506 %u2013 %u2013 %u2013 %u2013 %u2013 %u2013 %u2013Rent on land 1 420 %u2013 %u2013 %u2013 %u2013 %u2013 %u2013 %u2013 %u2013Transfers and subsidies 3 131 666 3 075 030 4 030 478 3 993 833 3 998 874 4 135 360 4 215 111 4 445 053 4 605 144 1.9 Prov inces and municipalities %u2013 %u2013 %u2013 %u2013 %u2013 %u2013 %u2013 %u2013 %u2013Prov inces %u2013 %u2013 %u2013 %u2013 %u2013 %u2013 %u2013 %u2013 %u2013Prov incial Rev enue Funds %u2013 %u2013 %u2013 %u2013 %u2013 %u2013 %u2013 %u2013 %u2013Prov incial agencies and funds %u2013 %u2013 %u2013 %u2013 %u2013 %u2013 %u2013 %u2013 %u2013Municipalities %u2013 %u2013 %u2013 %u2013 %u2013 %u2013 %u2013 %u2013 %u2013Municipal bank accounts %u2013 %u2013 %u2013 %u2013 %u2013 %u2013 %u2013 %u2013 %u2013Municipal agencies and funds %u2013 %u2013 %u2013 %u2013 %u2013 %u2013 %u2013 %u2013 %u2013Departmental agencies and accounts 65 150 68 360 71 365 74 569 74 569 74 569 77 910 81 416 85 080 4.5Social security funds %u2013 %u2013 %u2013 %u2013 %u2013 %u2013 %u2013 %u2013 %u2013Departmental agencies (non-business entities) 65 150 68 360 71 365 74 569 74 569 74 569 77 910 81 416 85 080 4.5Higher education institutions 14 288 15 110 15 718 14 841 14 841 14 819 17 229 18 004 18 814 16.3Foreign gov ernments and international organisations %u2013 %u2013 %u2013 %u2013 %u2013 %u2013 %u2013 %u2013 %u2013Public corporations and priv ate enterprises %u2013 %u2013 %u2013 %u2013 %u2013 %u2013 %u2013 %u2013 %u2013Public corporations %u2013 %u2013 %u2013 %u2013 %u2013 %u2013 %u2013 %u2013 %u2013Subsidies on products and production (pc) %u2013 %u2013 %u2013 %u2013 %u2013 %u2013 %u2013 %u2013 %u2013Other transfers to public corporations %u2013 %u2013 %u2013 %u2013 %u2013 %u2013 %u2013 %u2013 %u2013Priv ate enterprises %u2013 %u2013 %u2013 %u2013 %u2013 %u2013 %u2013 %u2013 %u2013Subsidies on products and production (pe) %u2013 %u2013 %u2013 %u2013 %u2013 %u2013 %u2013 %u2013 %u2013Other transfers to priv ate enterprises %u2013 %u2013 %u2013 %u2013 %u2013 %u2013 %u2013 %u2013 %u2013Non-profit institutions 2 779 601 2 746 986 3 593 959 3 726 644 3 691 630 3 712 348 3 912 620 4 128 528 4 274 374 5.4Households 272 627 244 574 349 436 177 779 217 834 333 624 207 352 217 105 226 876 (37.8)Social benefits %u2013 %u2013 %u2013 %u2013 %u2013 %u2013 %u2013 %u2013 %u2013Other transfers to households 272 627 244 574 349 436 177 779 217 834 333 624 207 352 217 105 226 876 (37.8)Payments for capital assets 921 304 1 344 625 1 051 775 1 141 565 1 134 737 1 118 761 1 219 027 1 322 753 1 490 150 9.0Buildings and other fix ed structures 845 354 1 297 863 1 020 470 1 069 091 1 047 268 1 032 929 1 156 055 1 274 406 1 439 628 11.9Buildings %u2013 %u2013 %u2013 227 354 %u2013 %u2013 %u2013 %u2013 %u2013Other fix ed structures 845 354 1 297 863 1 020 470 1 069 091 819 914 1 032 929 1 156 055 1 274 406 1 439 628 11.9Machinery and equipment 75 685 46 762 30 895 54 674 84 119 82 482 62 386 48 347 50 522 (24.4)Transport equipment 35 267 43 146 3 688 39 121 55 627 53 903 39 272 38 642 40 381 (27.1)Other machinery and equipment 40 418 3 616 27 207 15 553 28 492 28 579 23 114 9 705 10 141 (19.1)Heritage Assets %u2013 %u2013 %u2013 %u2013 %u2013 %u2013 %u2013 %u2013 %u2013Specialised military assets %u2013 %u2013 %u2013 %u2013 %u2013 %u2013 %u2013 %u2013 %u2013Biological assets %u2013 %u2013 %u2013 %u2013 %u2013 %u2013 %u2013 %u2013 %u2013Land and sub-soil assets %u2013 %u2013 %u2013 %u2013 %u2013 %u2013 %u2013 %u2013 %u2013Softw are and other intangible assets 265 %u2013 410 17 800 3 350 3 350 586 %u2013 %u2013 (82.5)Payments for financial assets %u2013 %u2013 %u2013 %u2013 %u2013 %u2013 %u2013 %u2013 %u2013Total economic classification 37 346 365 39 288 014 41 047 473 42 441 422 42 452 279 42 452 279 44 636 479 46 160 403 48 190 228 5.12024/25 363
