
Page 530 - Demo
P. 530
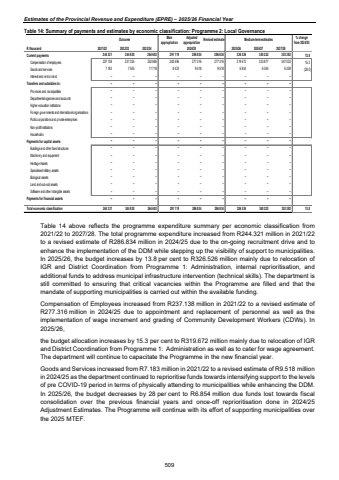
Estimates of the Provincial Revenue and Expenditure (EPRE) %u2013 2025/26 Financial YearTable 14: Summary of payments and estimates by economic classification: Programme 2: Local Governance Outcome Main appropriationAdjusted appropriation Revised estimate Medium-term estimates % change from 2024/25R thousand 2021/22 2022/23 2023/24 2025/26 2026/27 2027/28Current payments 244 321 244 830 264 603 291 119 286 834 286 834 326 526 340 222 353 382 13.8Compensation of employees 237 138 237 325 252 885 282 696 277 316 277 316 319 672 333 877 347 023 15.3Goods and services 7 183 7 505 11 718 8 423 9 518 9 518 6 854 6 345 6 359 (28.0)Interest and rent on land %u2013 %u2013 %u2013 %u2013 %u2013 %u2013 %u2013 %u2013 %u2013Transfers and subsidies to: %u2013 %u2013 %u2013 %u2013 %u2013 %u2013 %u2013 %u2013 %u2013Provinces and municipalities %u2013 %u2013 %u2013 %u2013 %u2013 %u2013 %u2013 %u2013 %u2013Departmental agencies and accounts %u2013 %u2013 %u2013 %u2013 %u2013 %u2013 %u2013 %u2013 %u2013Higher education institutions %u2013 %u2013 %u2013 %u2013 %u2013 %u2013 %u2013 %u2013 %u2013Foreign governments and international organisations %u2013 %u2013 %u2013 %u2013 %u2013 %u2013 %u2013 %u2013 %u2013Public corporations and private enterprises %u2013 %u2013 %u2013 %u2013 %u2013 %u2013 %u2013 %u2013 %u2013Non-profit institutions %u2013 %u2013 %u2013 %u2013 %u2013 %u2013 %u2013 %u2013 %u2013Households %u2013 %u2013 %u2013 %u2013 %u2013 %u2013 %u2013 %u2013 %u2013Payments for capital assets %u2013 %u2013 %u2013 %u2013 %u2013 %u2013 %u2013 %u2013 %u2013Buildings and other fixed structures %u2013 %u2013 %u2013 %u2013 %u2013 %u2013 %u2013 %u2013 %u2013Machinery and equipment %u2013 %u2013 %u2013 %u2013 %u2013 %u2013 %u2013 %u2013 %u2013Heritage Assets %u2013 %u2013 %u2013 %u2013 %u2013 %u2013 %u2013 %u2013 %u2013Specialised military assets %u2013 %u2013 %u2013 %u2013 %u2013 %u2013 %u2013 %u2013 %u2013Biological assets %u2013 %u2013 %u2013 %u2013 %u2013 %u2013 %u2013 %u2013 %u2013Land and sub-soil assets %u2013 %u2013 %u2013 %u2013 %u2013 %u2013 %u2013 %u2013 %u2013Software and other intangible assets %u2013 %u2013 %u2013 %u2013 %u2013 %u2013 %u2013 %u2013 %u2013Payments for financial assets %u2013 %u2013 %u2013 %u2013 %u2013 %u2013 %u2013 %u2013 %u2013Total economic classification 244 321 244 830 264 603 291 119 286 834 286 834 326 526 340 222 353 382 13.82024/25 Table 14 above reflects the programme expenditure summary per economic classification from 2021/22 to 2027/28. The total programme expenditure increased from R244.321 million in 2021/22 to a revised estimate of R286.834 million in 2024/25 due to the on-going recruitment drive and to enhance the implementation of the DDM while stepping up the visibility of support to municipalities. In 2025/26, the budget increases by 13.8 per cent to R326.526 million mainly due to relocation of IGR and District Coordination from Programme 1: Administration, internal reprioritisation, and additional funds to address municipal infrastructure intervention (technical skills). The department is still committed to ensuring that critical vacancies within the Programme are filled and that the mandate of supporting municipalities is carried out within the available funding. Compensation of Employees increased from R237.138 million in 2021/22 to a revised estimate of R277.316 million in 2024/25 due to appointment and replacement of personnel as well as the implementation of wage increment and grading of Community Development Workers (CDWs). In 2025/26, the budget allocation increases by 15.3 per cent to R319.672 million mainly due to relocation of IGR and District Coordination from Programme 1: Administration as well as to cater for wage agreement. The department will continue to capacitate the Programme in the new financial year. Goods and Services increased from R7.183 million in 2021/22 to a revised estimate of R9.518 million in 2024/25 as the department continued to reprioritise funds towards intensifying support to the levels of pre COVID-19 period in terms of physically attending to municipalities while enhancing the DDM. In 2025/26, the budget decreases by 28 per cent to R6.854 million due funds lost towards fiscal consolidation over the previous financial years and once-off reprioritisation done in 2024/25 Adjustment Estimates. The Programme will continue with its effort of supporting municipalities over the 2025 MTEF. 509
