
Page 541 - Demo
P. 541
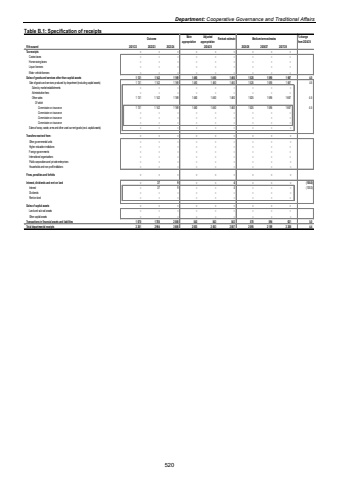
Department: Cooperative Governance and Traditional AffairsTable B.1: Specification of receipts Outcome Main appropriationAdjusted appropriation Revised estimate Medium-term estimates % change from 2024/25R thousand 2021/22 2022/23 2023/24 2025/26 2026/27 2027/28Tax receipts %u2013 %u2013 %u2013 %u2013 %u2013 %u2013 %u2013 %u2013 %u2013 Casino taxes %u2013 %u2013 %u2013 %u2013 %u2013 %u2013 %u2013 %u2013 %u2013 Horse racing taxes %u2013 %u2013 %u2013 %u2013 %u2013 %u2013 %u2013 %u2013 %u2013 Liquor licences %u2013 %u2013 %u2013 %u2013 %u2013 %u2013 %u2013 %u2013 %u2013 Motor vehicle licences %u2013 %u2013 %u2013 %u2013 %u2013 %u2013 %u2013 %u2013 %u2013 Sales of goods and services other than capital assets 1 131 1 142 1 169 1 460 1 460 1 460 1 525 1 595 1 667 4.5Sale of goods and services produced by department (excluding capital assets) 1 131 1 142 1 169 1 460 1 460 1 460 1 525 1 595 1 667 4.5Sales by market establishments %u2013 %u2013 %u2013 %u2013 %u2013 %u2013 %u2013 %u2013 %u2013 Administrative fees %u2013 %u2013 %u2013 %u2013 %u2013 %u2013 %u2013 %u2013 %u2013Other sales 1 131 1 142 1 169 1 460 1 460 1 460 1 525 1 595 1 667 4.5Of whichCommission on insurance 1 131 1 142 1 169 1 460 1 460 1 460 1 525 1 595 1 667 4.5Commission on insurance %u2013 %u2013 %u2013 %u2013 %u2013 %u2013 %u2013 %u2013 %u2013Commission on insurance %u2013 %u2013 %u2013 %u2013 %u2013 %u2013 %u2013 %u2013 %u2013Commission on insurance %u2013 %u2013 %u2013 %u2013 %u2013 %u2013 %u2013 %u2013 %u2013Sales of scrap, waste, arms and other used current goods (excl. capital assets) %u2013 %u2013 %u2013 %u2013 %u2013 %u2013 %u2013 %u2013 %u2013Transfers received from: %u2013 %u2013 %u2013 %u2013 %u2013 %u2013 %u2013 %u2013 %u2013Other governmental units %u2013 %u2013 %u2013 %u2013 %u2013 %u2013 %u2013 %u2013 %u2013Higher education institutions %u2013 %u2013 %u2013 %u2013 %u2013 %u2013 %u2013 %u2013 %u2013Foreign governments %u2013 %u2013 %u2013 %u2013 %u2013 %u2013 %u2013 %u2013 %u2013International organisations %u2013 %u2013 %u2013 %u2013 %u2013 %u2013 %u2013 %u2013 %u2013Public corporations and private enterprises %u2013 %u2013 %u2013 %u2013 %u2013 %u2013 %u2013 %u2013 %u2013Households and non-profit institutions %u2013 %u2013 %u2013 %u2013 %u2013 %u2013 %u2013 %u2013 %u2013Fines, penalties and forfeits %u2013 %u2013 %u2013 %u2013 %u2013 %u2013 %u2013 %u2013 %u2013Interest, dividends and rent on land %u2013 37 9 %u2013 %u2013 4 %u2013 %u2013 %u2013 (100.0)Interest %u2013 37 9 %u2013 %u2013 4 %u2013 %u2013 %u2013 (100.0)Dividends %u2013 %u2013 %u2013 %u2013 %u2013 %u2013 %u2013 %u2013 %u2013Rent on land %u2013 %u2013 %u2013 %u2013 %u2013 %u2013 %u2013 %u2013 %u2013Sales of capital assets %u2013 %u2013 %u2013 %u2013 %u2013 %u2013 %u2013 %u2013 %u2013Land and sub-soil assets %u2013 %u2013 %u2013 %u2013 %u2013 %u2013 %u2013 %u2013 %u2013Other capital assets %u2013 %u2013 %u2013 %u2013 %u2013 %u2013 %u2013 %u2013 %u2013Transactions in financial assets and liabilities 1 070 1 785 2 508 543 543 543 570 594 621 5.0Total departmental receipts 2 201 2 964 3 686 2 003 2 003 2 007 2 095 2 189 2 288 4.42024/25 520
