
Page 538 - Demo
P. 538
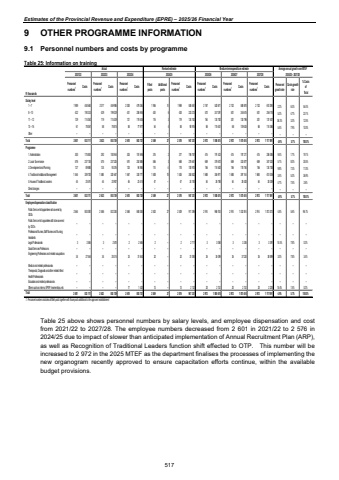
Estimates of the Provincial Revenue and Expenditure (EPRE) %u2013 2025/26 Financial Year9 OTHER PROGRAMME INFORMATION 9.1 Personnel numbers and costs by programme Table 25: Information on training Actual Revised estimate Medium-term expenditure estimateR thousandsPersonnel numbers1 Costs Personnel numbers1 Costs Personnel numbers1 Costs Filled postsAdditional postsPersonnel numbers1 Costs Personnel numbers1 Costs Personnel numbers1 Costs Personnel numbers1 Costs Personnel growth rate Costs growth rate % Costs of Total Salary level1 %u2013 7 1 989 450 648 2 017 459 986 2 000 479 264 1 955 14 1 969 508 461 2 167 520 671 2 102 588 678 2 102 610 298 2.2% 6.3% 54.4%8 %u2013 10 422 190 333 429 199 029 431 206 945 424 6 430 223 213 573 247 391 501 246 515 501 256 118 5.2% 4.7% 23.1%11 %u2013 12 129 114 062 119 115 309 121 119 535 116 3 119 124 742 164 124 782 301 130 796 301 137 407 36.3% 3.3% 12.5%13 %u2013 16 61 78 067 58 78 815 58 77 977 54 4 58 90 915 68 115 631 68 109 425 68 114 068 5.4% 7.9% 10.0%Other %u2013 %u2013 %u2013 %u2013 %u2013 %u2013 %u2013 %u2013 %u2013 %u2013 %u2013 %u2013 %u2013 %u2013 %u2013 %u2013 %u2013 %u2013 %u2013Total 2 601 833 111 2 623 853 139 2 610 883 721 2 549 27 2 576 947 331 2 972 1 008 474 2 972 1 075 414 2 972 1 117 891 4.9% 5.7% 100.0%Programme1. Administration 300 175 883 292 180 944 303 181 695 315 2 317 195 757 415 191 423 415 197 211 415 206 085 9.4% 1.7% 19.1%2. Local Governance 576 237 138 575 237 325 574 252 885 565 3 568 275 641 659 319 672 659 333 877 659 347 023 5.1% 8.0% 30.5%3. Development and Planning 127 89 888 124 93 316 120 94 955 114 4 118 100 910 156 114 620 156 118 754 156 124 738 9.8% 7.3% 11.0%4. Traditional Institutional Management 1 554 309 728 1 588 320 647 1 567 330 771 1 508 18 1 526 350 832 1 688 355 971 1 688 397 144 1 688 410 006 3.4% 5.3% 36.9%5. House of Traditional Leaders 44 20 474 44 20 907 46 23 414 47 %u2013 47 24 192 54 26 788 54 28 428 54 30 039 4.7% 7.5% 2.6%Direct charges %u2013 %u2013 %u2013 %u2013 %u2013 %u2013 %u2013 %u2013 %u2013 %u2013 %u2013 %u2013 %u2013 %u2013 %u2013 %u2013 %u2013 %u2013 %u2013Total 2 601 833 111 2 623 853 139 2 610 883 720 2 549 27 2 576 947 331 2 972 1 008 474 2 972 1 075 414 2 972 1 117 891 4.9% 5.7% 100.0%Employee dispensation classificationPublic Service Act appointees not covered by OSDs 2 564 803 092 2 586 822 250 2 558 848 004 2 502 27 2 529 911 395 2 914 968 183 2 914 1 032 814 2 914 1 073 373 4.8% 5.6% 96.1%Public Service Act appointees still to be covered by OSDs %u2013 %u2013 %u2013 %u2013 %u2013 %u2013 %u2013 %u2013 %u2013 %u2013 %u2013 %u2013 %u2013 %u2013 %u2013 %u2013 %u2013 %u2013 %u2013Professional Nurses, Staff Nurses and Nursing Assistants %u2013 %u2013 %u2013 %u2013 %u2013 %u2013 %u2013 %u2013 %u2013 %u2013 %u2013 %u2013 %u2013 %u2013 %u2013 %u2013 %u2013 %u2013 %u2013Legal Professionals 3 2 465 3 2 575 2 2 645 2 %u2013 2 2 711 3 3 060 3 3 245 3 3 391 14.5% 7.8% 0.3%Social Services Professions %u2013 %u2013 %u2013 %u2013 %u2013 %u2013 %u2013 %u2013 %u2013 %u2013 %u2013 %u2013 %u2013 %u2013 %u2013 %u2013 %u2013 %u2013 %u2013Engineering Professions and related occupations 34 27 554 34 28 314 33 31 653 32 %u2013 32 31 093 35 35 099 35 37 224 35 38 899 3.0% 7.8% 3.4%Medical and related professionals %u2013 %u2013 %u2013 %u2013 %u2013 %u2013 %u2013 %u2013 %u2013 %u2013 %u2013 %u2013 %u2013 %u2013 %u2013 %u2013 %u2013 %u2013 %u2013Therapeutic, Diagnostic and other related Allied Health Professionals %u2013 %u2013 %u2013 %u2013 %u2013 %u2013 %u2013 %u2013 %u2013 %u2013 %u2013 %u2013 %u2013 %u2013 %u2013 %u2013 %u2013 %u2013 %u2013Educators and related professionals %u2013 %u2013 %u2013 %u2013 %u2013 %u2013 %u2013 %u2013 %u2013 %u2013 %u2013 %u2013 %u2013 %u2013 %u2013 %u2013 %u2013 %u2013 %u2013Others such as interns, EPWP, learnerships, etc %u2013 %u2013 %u2013 %u2013 17 1 420 13 %u2013 13 2 132 20 2 132 20 2 132 20 2 228 15.4% 1.5% 0.2%Total 2 601 833 111 2 623 853 139 2 610 883 721 2 549 27 2 576 947 331 2 972 1 008 474 2 972 1 075 414 2 972 1 117 891 4.9% 5.7% 100.0%1. Personnel numbers includes all filled posts together with those posts additional to the approved establishment Average annual growth over MTEF 2021/22 2022/23 2023/24 2024/25 2025/26 2026/27 2027/28 2024/25 - 2027/28Table 25 above shows personnel numbers by salary levels, and employee dispensation and cost from 2021/22 to 2027/28. The employee numbers decreased from 2 601 in 2021/22 to 2 576 in 2024/25 due to impact of slower than anticipated implementation of Annual Recruitment Plan (ARP), as well as Recognition of Traditional Leaders function shift effected to OTP. This number will be increased to 2 972 in the 2025 MTEF as the department finalises the processes of implementing the new organogram recently approved to ensure capacitation efforts continue, within the available budget provisions. 517
