
Page 543 - Demo
P. 543
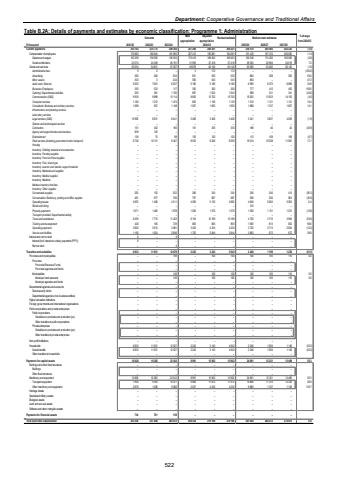
Department: Cooperative Governance and Traditional AffairsTable B.2A: Details of payments and estimates by economic classification: Programme 1: Administration Outcome Main appropriationAdjusted appropriation Revised estimate Medium-term estimates % change from 2024/25R thousand 2021/22 2022/23 2023/24 2025/26 2026/27 2027/28Current payments 235 143 235 775 249 256 257 290 260 021 258 221 254 513 250 692 262 225 (1.4)Compensation of employees 175 883 180 944 181 695 207 412 195 881 194 081 191 423 197 210 206 085 (1.4)Salaries and wages 152 309 156 595 156 504 175 419 168 463 166 663 162 040 174 226 182 066 (2.8)Social contributions 23 574 24 349 25 191 31 993 27 418 27 418 29 383 22 984 24 019 7.2Goods and services 59 254 54 831 67 557 49 878 64 140 64 140 63 090 53 482 56 140 (1.6)Administrative fees 5 2 %u2013 3 172 172 %u2013 %u2013 %u2013 (100.0)Advertising 565 284 934 651 530 530 864 368 362 63.0Minor assets 303 3 244 500 543 543 800 %u2013 %u2013 47.3Audit costs: External 5 553 7 001 6 257 5 180 5 180 5 180 6 990 6 573 6 889 34.9Bursaries: Employees 392 533 117 300 300 300 777 412 452 159.0Catering: Departmental activities 263 381 1 192 897 1 043 1 043 588 331 341 (43.6)Communication (G&S) 9 930 9 898 13 114 8 805 15 702 15 702 15 003 13 553 14 103 (4.5)Computer services 1 184 1 212 1 474 825 1 136 1 135 1 310 1 121 1 121 15.4Consultants: Business and advisory services 1 089 927 1 148 1 507 1 655 1 655 1 888 1 747 1 827 14.1Infrastructure and planning services %u2013 %u2013 %u2013 %u2013 %u2013 %u2013 %u2013 %u2013 %u2013Laboratory services %u2013 %u2013 %u2013 %u2013 %u2013 %u2013 %u2013 %u2013 %u2013Legal services (G&S) 12 992 6 631 8 441 3 406 3 406 3 406 3 341 3 827 4 009 (1.9)Science and technological services %u2013 %u2013 %u2013 %u2013 %u2013 %u2013 %u2013 %u2013 %u2013Contractors 151 432 165 101 335 335 188 40 42 (43.9)Agency and support/outsourced services 839 140 %u2013 %u2013 %u2013 %u2013 %u2013 %u2013 %u2013Entertainment 136 75 98 120 120 120 112 108 108 (6.7)Fleet services (including government motor transport) 6 736 10 131 8 427 8 553 8 240 8 555 10 014 10 528 11 081 17.1Housing %u2013 %u2013 %u2013 %u2013 %u2013 %u2013 %u2013 %u2013 %u2013Inventory: Clothing material and accessories %u2013 %u2013 %u2013 %u2013 %u2013 %u2013 %u2013 %u2013 %u2013Inventory: Farming supplies %u2013 %u2013 %u2013 %u2013 %u2013 %u2013 %u2013 %u2013 %u2013Inventory: Food and food supplies %u2013 %u2013 %u2013 %u2013 %u2013 %u2013 %u2013 %u2013 %u2013Inventory: Fuel, oil and gas %u2013 %u2013 %u2013 %u2013 %u2013 %u2013 %u2013 %u2013 %u2013Inventory: Learner and teacher support material %u2013 %u2013 %u2013 %u2013 %u2013 %u2013 %u2013 %u2013 %u2013Inventory: Materials and supplies %u2013 %u2013 %u2013 %u2013 %u2013 %u2013 %u2013 %u2013 %u2013Inventory: Medical supplies %u2013 %u2013 %u2013 %u2013 %u2013 %u2013 %u2013 %u2013 %u2013Inventory: Medicine %u2013 %u2013 %u2013 %u2013 %u2013 %u2013 %u2013 %u2013 %u2013Medsas inventory interface %u2013 %u2013 %u2013 %u2013 %u2013 %u2013 %u2013 %u2013 %u2013Inventory: Other supplies %u2013 %u2013 %u2013 %u2013 %u2013 %u2013 %u2013 %u2013 %u2013Consumable supplies 253 152 522 280 334 334 236 246 413 (29.3)Consumables: Stationery, printing and office supplies 461 977 706 797 687 687 558 526 564 (18.8)Operating leases 4 870 1 458 4 311 4 290 5 135 4 820 4 840 5 063 5 305 0.4Rental and hiring %u2013 %u2013 %u2013 %u2013 %u2013 %u2013 310 %u2013 %u2013Property payments 1 671 1 483 1 678 1 550 1 570 1 570 1 356 1 131 1 231 (13.6)Transport provided: Departmental activity %u2013 %u2013 %u2013 %u2013 %u2013 %u2013 %u2013 %u2013 %u2013Travel and subsistence 6 455 7 710 11 423 6 154 10 169 10 169 4 720 3 710 3 964 (53.6)Training and development 426 165 729 805 805 805 1 583 813 832 96.6Operating payments 3 820 3 612 3 881 3 452 4 234 4 235 3 720 2 713 2 824 (12.2)Venues and facilities 1 160 1 624 2 696 1 702 2 844 2 844 3 892 672 672 36.8Interest and rent on land 6 %u2013 4 %u2013 %u2013 %u2013 %u2013 %u2013 %u2013Interest (Incl. interest on unitary payments (PPP)) 6 %u2013 %u2013 %u2013 %u2013 %u2013 %u2013 %u2013 %u2013Rent on land %u2013 %u2013 4 %u2013 %u2013 %u2013 %u2013 %u2013 %u2013Transfers and subsidies 6 833 11 031 12 676 2 243 3 243 5 043 2 446 1 199 1 256 (51.5)Provinces and municipalities %u2013 %u2013 149 %u2013 100 100 100 105 110 0.0Provinces %u2013 %u2013 %u2013 %u2013 %u2013 %u2013 %u2013 %u2013 %u2013Provincial Revenue Funds %u2013 %u2013 %u2013 %u2013 %u2013 %u2013 %u2013 %u2013 %u2013Provincial agencies and funds %u2013 %u2013 %u2013 %u2013 %u2013 %u2013 %u2013 %u2013 %u2013Municipalities %u2013 %u2013 149 %u2013 100 100 100 105 110 0.0Municipal bank accounts %u2013 %u2013 149 %u2013 100 100 100 105 110 0.0Municipal agencies and funds %u2013 %u2013 %u2013 %u2013 %u2013 %u2013 %u2013 %u2013 %u2013Departmental agencies and accounts %u2013 %u2013 %u2013 %u2013 %u2013 %u2013 %u2013 %u2013 %u2013Social security funds %u2013 %u2013 %u2013 %u2013 %u2013 %u2013 %u2013 %u2013 %u2013Departmental agencies (non-business entities) %u2013 %u2013 %u2013 %u2013 %u2013 %u2013 %u2013 %u2013 %u2013Higher education institutions %u2013 %u2013 %u2013 %u2013 %u2013 %u2013 %u2013 %u2013 %u2013Foreign governments and international organisations %u2013 %u2013 %u2013 %u2013 %u2013 %u2013 %u2013 %u2013 %u2013Public corporations and private enterprises %u2013 %u2013 %u2013 %u2013 %u2013 %u2013 %u2013 %u2013 %u2013Public corporations %u2013 %u2013 %u2013 %u2013 %u2013 %u2013 %u2013 %u2013 %u2013Subsidies on products and production (pc) %u2013 %u2013 %u2013 %u2013 %u2013 %u2013 %u2013 %u2013 %u2013Other transfers to public corporations %u2013 %u2013 %u2013 %u2013 %u2013 %u2013 %u2013 %u2013 %u2013Private enterprises %u2013 %u2013 %u2013 %u2013 %u2013 %u2013 %u2013 %u2013 %u2013Subsidies on products and production (pe) %u2013 %u2013 %u2013 %u2013 %u2013 %u2013 %u2013 %u2013 %u2013Other transfers to private enterprises %u2013 %u2013 %u2013 %u2013 %u2013 %u2013 %u2013 %u2013 %u2013Non-profit institutions %u2013 %u2013 %u2013 %u2013 %u2013 %u2013 %u2013 %u2013 %u2013Households 6 833 11 031 12 527 2 243 3 143 4 943 2 346 1 094 1 146 (52.5)Social benefits 6 833 11 031 12 527 2 243 3 143 4 943 2 346 1 094 1 146 (52.5)Other transfers to households %u2013 %u2013 %u2013 %u2013 %u2013 %u2013 %u2013 %u2013 %u2013Payments for capital assets 10 828 10 382 23 543 8 991 15 902 15 902 24 691 12 321 13 489 55.3Buildings and other fixed structures %u2013 %u2013 %u2013 %u2013 %u2013 %u2013 %u2013 %u2013 %u2013Buildings %u2013 %u2013 %u2013 %u2013 %u2013 %u2013 %u2013 %u2013 %u2013Other fixed structures %u2013 %u2013 %u2013 %u2013 %u2013 %u2013 %u2013 %u2013 %u2013Machinery and equipment 10 828 10 382 23 543 8 991 15 902 15 902 24 691 12 321 13 489 55.3Transport equipment 7 950 9 354 14 477 6 964 11 672 11 672 14 806 11 214 12 330 26.9Other machinery and equipment 2 878 1 028 9 066 2 027 4 230 4 230 9 885 1 107 1 159 133.7Heritage Assets %u2013 %u2013 %u2013 %u2013 %u2013 %u2013 %u2013 %u2013 %u2013Specialised military assets %u2013 %u2013 %u2013 %u2013 %u2013 %u2013 %u2013 %u2013 %u2013Biological assets %u2013 %u2013 %u2013 %u2013 %u2013 %u2013 %u2013 %u2013 %u2013Land and sub-soil assets %u2013 %u2013 %u2013 %u2013 %u2013 %u2013 %u2013 %u2013 %u2013Software and other intangible assets %u2013 %u2013 %u2013 %u2013 %u2013 %u2013 %u2013 %u2013 %u2013Payments for financial assets 734 701 158 %u2013 %u2013 %u2013 %u2013 %u2013 %u2013Total economic classification 253 538 257 889 285 633 268 524 279 166 279 166 281 650 264 212 276 970 0.92024/25522
