
Page 542 - Demo
P. 542
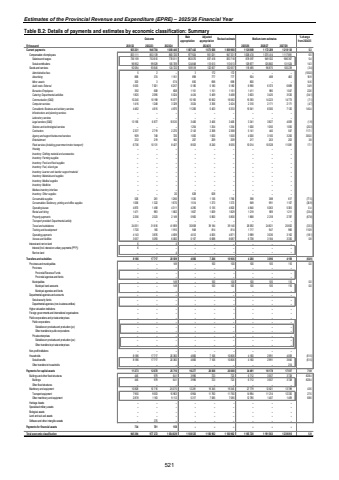
Estimates of the Provincial Revenue and Expenditure (EPRE) %u2013 2025/26 Financial YearTable B.2: Details of payments and estimates by economic classification: Summary Outcome Main appropriationAdjusted appropriation Revised estimate Medium-term estimates % change from 2024/25R thousand 2021/22 2022/23 2023/24 2025/26 2026/27 2027/28Current payments 946 784 925 201 1 008 446 1 087 442 1 073 688 1 069 988 1 126 969 1 172 289 1 218 130 5.3Compensation of employees 833 111 853 139 883 720 977 924 951 031 947 331 1 008 474 1 075 414 1 117 891 6.5Salaries and wages 736 159 753 610 778 011 853 076 837 418 833 718 878 597 949 532 986 367 5.4Social contributions 96 952 99 529 105 709 124 848 113 613 113 613 129 877 125 882 131 524 14.3Goods and services 92 084 93 645 124 722 109 518 122 657 122 657 118 495 96 875 100 239 (3.4)Administrative fees 2 5 %u2013 3 172 172 %u2013 %u2013 %u2013 (100.0)Advertising 374 868 1 161 898 777 777 924 488 482 18.9Minor assets 3 303 574 650 698 698 800 %u2013 %u2013 14.6Audit costs: External 5 553 7 001 6 257 5 180 5 180 5 180 6 990 6 573 6 889 34.9Bursaries: Employees 392 608 608 1 151 1 151 1 151 1 411 985 1 047 22.6Catering: Departmental activities 1 825 2 095 5 024 4 434 5 469 5 468 3 603 3 425 3 530 (34.1)Communication (G&S) 10 240 10 198 15 077 10 165 16 562 16 562 15 393 14 223 14 773 (7.1)Computer services 1 416 1 248 3 329 3 024 3 356 2 424 2 310 2 171 2 171 (4.7)Consultants: Business and advisory services 4 462 4 615 4 875 11 206 5 403 6 333 15 541 8 300 7 120 145.4Infrastructure and planning services %u2013 %u2013 %u2013 %u2013 %u2013 %u2013 %u2013 %u2013 %u2013Laboratory services %u2013 %u2013 %u2013 %u2013 %u2013 %u2013 %u2013 %u2013 %u2013Legal services (G&S) 13 156 6 877 10 535 3 406 3 406 3 406 3 341 3 827 4 009 (1.9)Science and technological services %u2013 %u2013 %u2013 1 254 1 254 1 254 1 000 1 050 1 050 (20.3)Contractors 2 337 2 719 2 270 2 143 2 368 2 368 5 141 445 547 117.1Agency and support/outsourced services 909 748 720 1 000 1 000 1 000 4 000 3 100 3 200 300.0Entertainment 232 219 182 207 209 209 217 203 203 3.8Fleet services (including government motor transport) 6 736 10 131 8 427 8 553 8 240 8 555 10 014 10 528 11 081 17.1Housing %u2013 %u2013 %u2013 %u2013 %u2013 %u2013 %u2013 %u2013 %u2013Inventory: Clothing material and accessories %u2013 %u2013 %u2013 %u2013 %u2013 %u2013 %u2013 %u2013 %u2013Inventory: Farming supplies %u2013 %u2013 %u2013 %u2013 %u2013 %u2013 %u2013 %u2013 %u2013Inventory: Food and food supplies %u2013 %u2013 %u2013 %u2013 %u2013 %u2013 %u2013 %u2013 %u2013Inventory: Fuel, oil and gas %u2013 %u2013 %u2013 %u2013 %u2013 %u2013 %u2013 %u2013 %u2013Inventory: Learner and teacher support material %u2013 %u2013 %u2013 %u2013 %u2013 %u2013 %u2013 %u2013 %u2013Inventory: Materials and supplies %u2013 %u2013 %u2013 %u2013 %u2013 %u2013 %u2013 %u2013 %u2013Inventory: Medical supplies %u2013 %u2013 %u2013 %u2013 %u2013 %u2013 %u2013 %u2013 %u2013Inventory: Medicine %u2013 %u2013 %u2013 %u2013 %u2013 %u2013 %u2013 %u2013 %u2013Medsas inventory interface %u2013 %u2013 %u2013 %u2013 %u2013 %u2013 %u2013 %u2013 %u2013Inventory: Other supplies %u2013 %u2013 20 628 628 %u2013 %u2013 %u2013 %u2013Consumable supplies 526 261 1 266 1 530 1 136 1 766 398 388 617 (77.5)Consumables: Stationery, printing and office supplies 1 056 1 322 1 670 1 514 1 373 1 373 949 991 1 107 (30.9)Operating leases 4 870 1 458 4 311 4 290 5 135 4 820 4 840 5 063 5 305 0.4Rental and hiring 1 471 993 1 802 1 607 1 829 1 829 1 219 909 1 211 (33.4)Property payments 2 256 2 023 2 149 5 900 5 800 5 800 1 868 2 218 2 787 (67.8)Transport provided: Departmental activity %u2013 %u2013 %u2013 %u2013 %u2013 %u2013 %u2013 %u2013 %u2013Travel and subsistence 24 051 31 616 41 859 30 658 39 184 39 140 26 092 24 821 25 652 (33.3)Training and development 1 720 165 1 915 948 814 814 1 717 947 966 110.9Operating payments 4 143 3 876 4 609 4 012 4 825 4 871 3 989 3 036 3 162 (18.1)Venues and facilities 3 557 5 093 6 082 5 157 6 688 6 687 6 738 3 184 3 330 0.8Interest and rent on land 6 %u2013 4 %u2013 %u2013 %u2013 %u2013 %u2013 %u2013Interest (Incl. interest on unitary payments (PPP)) 6 %u2013 %u2013 %u2013 %u2013 %u2013 %u2013 %u2013 %u2013Rent on land %u2013 %u2013 4 %u2013 %u2013 %u2013 %u2013 %u2013 %u2013Transfers and subsidies 8 186 17 717 20 509 4 806 7 206 10 906 4 260 3 096 4 169 (60.9)Provinces and municipalities %u2013 %u2013 149 %u2013 100 100 100 105 110 0.0Provinces %u2013 %u2013 %u2013 %u2013 %u2013 %u2013 %u2013 %u2013 %u2013Provincial Revenue Funds %u2013 %u2013 %u2013 %u2013 %u2013 %u2013 %u2013 %u2013 %u2013Provincial agencies and funds %u2013 %u2013 %u2013 %u2013 %u2013 %u2013 %u2013 %u2013 %u2013Municipalities %u2013 %u2013 149 %u2013 100 100 100 105 110 0.0Municipal bank accounts %u2013 %u2013 149 %u2013 100 100 100 105 110 0.0Municipal agencies and funds %u2013 %u2013 %u2013 %u2013 %u2013 %u2013 %u2013 %u2013 %u2013Departmental agencies and accounts %u2013 %u2013 %u2013 %u2013 %u2013 %u2013 %u2013 %u2013 %u2013Social security funds %u2013 %u2013 %u2013 %u2013 %u2013 %u2013 %u2013 %u2013 %u2013Departmental agencies (non-business entities) %u2013 %u2013 %u2013 %u2013 %u2013 %u2013 %u2013 %u2013 %u2013Higher education institutions %u2013 %u2013 %u2013 %u2013 %u2013 %u2013 %u2013 %u2013 %u2013Foreign governments and international organisations %u2013 %u2013 %u2013 %u2013 %u2013 %u2013 %u2013 %u2013 %u2013Public corporations and private enterprises %u2013 %u2013 %u2013 %u2013 %u2013 %u2013 %u2013 %u2013 %u2013Public corporations %u2013 %u2013 %u2013 %u2013 %u2013 %u2013 %u2013 %u2013 %u2013Subsidies on products and production (pc) %u2013 %u2013 %u2013 %u2013 %u2013 %u2013 %u2013 %u2013 %u2013Other transfers to public corporations %u2013 %u2013 %u2013 %u2013 %u2013 %u2013 %u2013 %u2013 %u2013Private enterprises %u2013 %u2013 %u2013 %u2013 %u2013 %u2013 %u2013 %u2013 %u2013Subsidies on products and production (pe) %u2013 %u2013 %u2013 %u2013 %u2013 %u2013 %u2013 %u2013 %u2013Other transfers to private enterprises %u2013 %u2013 %u2013 %u2013 %u2013 %u2013 %u2013 %u2013 %u2013Non-profit institutions %u2013 %u2013 %u2013 %u2013 %u2013 %u2013 %u2013 %u2013 %u2013Households 8 186 17 717 20 360 4 806 7 106 10 806 4 160 2 991 4 059 (61.5)Social benefits 8 186 17 717 20 360 4 806 7 106 10 806 4 160 2 991 3 845 (61.5)Other transfers to households %u2013 %u2013 %u2013 %u2013 %u2013 %u2013 %u2013 %u2013 214Payments for capital assets 11 273 12 070 25 716 16 277 20 068 20 068 34 491 16 178 17 517 71.9Buildings and other fixed structures 445 979 641 3 996 723 723 6 712 3 557 3 728 828.4Buildings 445 979 641 3 996 723 723 6 712 3 557 3 728 828.4Other fixed structures %u2013 %u2013 %u2013 %u2013 %u2013 %u2013 %u2013 %u2013 %u2013Machinery and equipment 10 828 10 716 25 075 12 281 19 345 19 345 27 779 12 621 13 789 43.6Transport equipment 7 950 9 553 15 963 6 964 11 760 11 760 14 994 11 214 12 330 27.5Other machinery and equipment 2 878 1 163 9 112 5 317 7 585 7 585 12 785 1 407 1 459 68.6Heritage Assets %u2013 %u2013 %u2013 %u2013 %u2013 %u2013 %u2013 %u2013 %u2013Specialised military assets %u2013 %u2013 %u2013 %u2013 %u2013 %u2013 %u2013 %u2013 %u2013Biological assets %u2013 %u2013 %u2013 %u2013 %u2013 %u2013 %u2013 %u2013 %u2013Land and sub-soil assets %u2013 %u2013 %u2013 %u2013 %u2013 %u2013 %u2013 %u2013 %u2013Software and other intangible assets %u2013 375 %u2013 %u2013 %u2013 %u2013 %u2013 %u2013 %u2013Payments for financial assets 734 701 158 %u2013 %u2013 %u2013 %u2013 %u2013 %u2013Total economic classification 945 394 977 272 1 054 829 1 108 525 1 100 962 1 100 962 1 165 720 1 191 563 1 239 816 5.92024/25521
