
Page 592 - Demo
P. 592
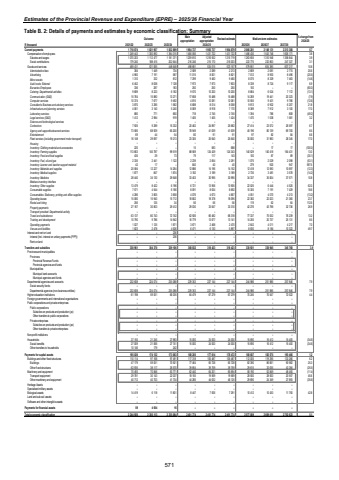
Estimates of the Provincial Revenue and Expenditure (EPRE) %u2013 2025/26 Financial YearTable B. 2: Details of payments and estimates by economic classification: Summary Outcome Main appropriationAdjusted appropriation Revised estimate Medium-term estimates % change from 2024/25R thousand 2021/22 2022/23 2023/24 2025/26 2026/27 2027/28Current payments 1 821 957 1 718 874 1 832 899 1 954 737 1 955 737 1 954 879 2 066 281 2 148 131 2 213 388 5.7Compensation of employees 1 249 443 1 300 892 1 384 015 1 456 056 1 431 722 1 431 722 1 486 430 1 543 746 1 606 171 3.8Salaries and wages 1 070 203 1 112 477 1 181 371 1 239 810 1 216 552 1 215 719 1 263 655 1 310 946 1 358 844 3.9Social contributions 179 240 188 415 202 644 216 246 215 170 216 003 222 775 232 800 247 327 3.1Goods and services 469 431 521 065 448 648 498 681 524 015 523 157 579 851 604 385 607 217 10.8Administrative fees 1 449 384 734 2 589 2 089 2 213 2 669 2 681 2 774 20.6Advertising 7 191 4 960 587 11 015 8 821 8 821 7 012 8 953 8 496 (20.5)Minor assets 332 1 310 812 7 299 9 460 9 460 8 075 8 329 7 463 (14.6)Audit costs: External 8 638 6 452 7 128 7 973 7 973 7 803 8 339 8 724 9 117 6.9Bursaries: Employees 287 336 183 250 250 250 100 %u2013 %u2013 (60.0)Catering: Departmental activities 8 223 9 689 6 182 9 570 10 200 10 200 8 864 6 524 7 172 (13.1)Communication (G&S) 15 880 15 764 13 271 17 658 15 488 15 488 14 269 19 441 20 323 (7.9)Computer services 7 677 10 374 9 492 4 815 12 081 12 081 10 555 9 401 9 786 (12.6)Consultants: Business and advisory services 3 285 3 870 1 582 6 688 8 014 8 058 9 813 6 902 6 207 21.8Infrastructure and planning services 3 140 4 061 5 240 8 069 8 918 7 170 8 389 7 912 3 100 17.0Laboratory services 771 880 850 718 2 745 2 745 1 394 786 808 (49.2)Legal services (G&S) 2 984 1 412 919 1 405 1 405 1 424 1 470 1 538 1 581 3.2Science and technological services %u2013 %u2013 %u2013 %u2013 %u2013 %u2013 %u2013 %u2013 %u2013Contractors 9 289 7 925 15 332 20 462 24 897 25 682 27 414 23 572 26 597 6.7Agency and support/outsourced services 68 929 73 585 65 200 78 949 41 639 41 639 45 196 80 139 69 700 8.5Entertainment 44 69 54 80 91 91 97 82 84 6.6Fleet services (including government motor transport) 29 697 16 148 19 213 23 305 25 640 25 640 30 000 31 983 28 345 17.0Housing %u2013 %u2013 %u2013 %u2013 %u2013 %u2013 %u2013 %u2013 %u2013Inventory: Clothing material and accessories 220 %u2013 %u2013 15 583 688 %u2013 17 17 (100.0)Inventory: Farming supplies 145 787 113 663 99 519 88 569 124 429 124 343 140 529 140 418 164 431 13.0Inventory: Food and food supplies 29 435 73 79 117 143 100 87 89 (30.1)Inventory: Fuel, oil and gas 2 441 2 335 1 122 2 239 2 654 2 291 1 075 2 029 2 098 (53.1)Inventory: Learner and teacher support material 17 42 %u2013 840 40 40 279 920 947 597.5Inventory: Materials and supplies 12 227 20 584 14 264 12 886 14 196 14 152 12 418 12 590 10 697 (12.3)Inventory: Medical supplies 847 1 877 1 874 3 182 3 189 3 189 2 735 3 481 3 578 (14.2)Inventory: Medicine 34 130 28 440 29 648 33 403 30 995 30 995 34 337 35 824 37 571 10.8Medsas inventory interface %u2013 %u2013 %u2013 %u2013 %u2013 %u2013 %u2013 %u2013 %u2013Inventory: Other supplies 8 422 13 479 6 196 6 721 13 956 13 905 22 525 6 444 4 525 62.0Consumable supplies 4 544 7 571 6 166 8 091 8 634 8 692 10 305 7 191 7 429 18.6Consumables: Stationery, printing and office supplies 3 805 4 286 3 658 4 076 4 673 4 667 4 051 4 070 4 213 (13.2)Operating leases 15 940 15 080 15 712 18 802 18 378 18 095 22 382 22 023 21 360 23.7Rental and hiring 125 256 34 56 56 56 119 62 64 112.5Property payments 30 803 27 167 29 412 29 030 33 647 33 310 42 276 43 798 32 736 26.9Transport provided: Departmental activity %u2013 %u2013 %u2013 %u2013 %u2013 %u2013 %u2013 %u2013 %u2013Travel and subsistence 80 743 63 137 72 742 62 926 66 482 68 318 77 337 75 532 76 239 13.2Training and development 9 786 10 790 14 942 16 779 13 677 13 141 14 255 20 737 25 131 8.5Operating payments 1 125 1 027 1 871 3 671 2 468 2 470 2 642 4 011 4 217 7.0Venues and facilities 2 478 1 823 4 636 6 471 6 130 5 897 8 830 8 184 10 322 49.7Interest and rent on land %u2013 %u2013 236 %u2013 %u2013 %u2013 %u2013 %u2013 %u2013Interest (Incl. interest on unitary payments (PPP)) %u2013 %u2013 236 %u2013 %u2013 %u2013 %u2013 %u2013 %u2013Rent on land %u2013 %u2013 %u2013 %u2013 %u2013 %u2013 %u2013 %u2013 %u2013Transfers and subsidies 330 961 304 370 329 106 308 832 318 423 318 423 330 921 338 945 345 768 3.9 Provinces and municipalities %u2013 %u2013 %u2013 %u2013 %u2013 %u2013 %u2013 %u2013 %u2013Provinces %u2013 %u2013 %u2013 %u2013 %u2013 %u2013 %u2013 %u2013 %u2013Provincial Revenue Funds %u2013 %u2013 %u2013 %u2013 %u2013 %u2013 %u2013 %u2013 %u2013Provincial agencies and funds %u2013 %u2013 %u2013 %u2013 %u2013 %u2013 %u2013 %u2013 %u2013Municipalities %u2013 %u2013 %u2013 %u2013 %u2013 %u2013 %u2013 %u2013 %u2013Municipal bank accounts %u2013 %u2013 %u2013 %u2013 %u2013 %u2013 %u2013 %u2013 %u2013Municipal agencies and funds %u2013 %u2013 %u2013 %u2013 %u2013 %u2013 %u2013 %u2013 %u2013Departmental agencies and accounts 232 608 224 074 235 088 229 353 227 144 227 144 244 986 251 986 257 846 7.9Social security funds %u2013 %u2013 %u2013 %u2013 %u2013 %u2013 %u2013 %u2013 %u2013Departmental agencies (non-business entities) 224 074 232 608 235 088 229 353 227 144 227 144 244 986 251 986 257 846 7.9Higher education institutions 61 198 59 051 66 035 64 479 67 279 67 279 70 245 70 547 72 522 4.4Foreign governments and international organisations %u2013 %u2013 %u2013 %u2013 %u2013 %u2013 %u2013 %u2013 %u2013Public corporations and private enterprises %u2013 %u2013 %u2013 %u2013 %u2013 %u2013 %u2013 %u2013 %u2013Public corporations %u2013 %u2013 %u2013 %u2013 %u2013 %u2013 %u2013 %u2013 %u2013Subsidies on products and production (pc) %u2013 %u2013 %u2013 %u2013 %u2013 %u2013 %u2013 %u2013 %u2013Other transfers to public corporations %u2013 %u2013 %u2013 %u2013 %u2013 %u2013 %u2013 %u2013 %u2013Private enterprises %u2013 %u2013 %u2013 %u2013 %u2013 %u2013 %u2013 %u2013 %u2013Subsidies on products and production (pe) %u2013 %u2013 %u2013 %u2013 %u2013 %u2013 %u2013 %u2013 %u2013Other transfers to private enterprises %u2013 %u2013 %u2013 %u2013 %u2013 %u2013 %u2013 %u2013 %u2013Non-profit institutions %u2013 %u2013 %u2013 %u2013 %u2013 %u2013 %u2013 %u2013 %u2013Households 21 245 37 155 27 983 15 000 24 000 24 000 15 690 16 412 15 400 (34.6)Social benefits 21 066 27 009 27 741 15 000 24 000 24 000 15 690 16 412 15 400 (34.6)Other transfers to households 10 146 179 242 %u2013 %u2013 %u2013 %u2013 %u2013 %u2013Payments for capital assets 195 026 174 132 173 063 188 205 177 614 178 472 180 607 182 575 193 466 1.2Buildings and other fixed structures 110 114 97 168 97 491 117 318 105 487 105 487 112 005 119 296 133 266 6.2Buildings 59 051 47 179 70 921 77 464 65 728 65 728 82 390 86 661 90 982 25.3Other fixed structures 62 935 38 117 26 570 39 854 39 759 39 759 29 615 32 635 42 284 (25.5)Machinery and equipment 70 493 70 846 63 771 62 440 64 201 65 694 58 190 52 849 48 450 (11.4)Transport equipment 29 781 30 143 22 037 18 155 19 569 19 569 28 500 28 500 20 557 45.6Other machinery and equipment 40 712 40 703 41 734 44 285 44 632 46 125 29 690 24 349 27 893 (35.6)Heritage Assets %u2013 %u2013 %u2013 %u2013 %u2013 %u2013 %u2013 %u2013 %u2013Specialised military assets %u2013 %u2013 %u2013 %u2013 %u2013 %u2013 %u2013 %u2013 %u2013Biological assets 6 118 14 419 11 801 8 447 7 926 7 291 10 412 10 430 11 750 42.8Land and sub-soil assets %u2013 %u2013 %u2013 %u2013 %u2013 %u2013 %u2013 %u2013 %u2013Software and other intangible assets %u2013 %u2013 %u2013 %u2013 %u2013 %u2013 %u2013 %u2013 %u2013Payments for financial assets 59 4 654 16 %u2013 %u2013 %u2013 %u2013 %u2013 %u2013Total economic classification 2 305 113 2 244 920 2 335 084 2 451 774 2 451 774 2 451 774 2 577 809 2 669 651 2 752 622 5.12024/25571
