
Page 602 - Demo
P. 602
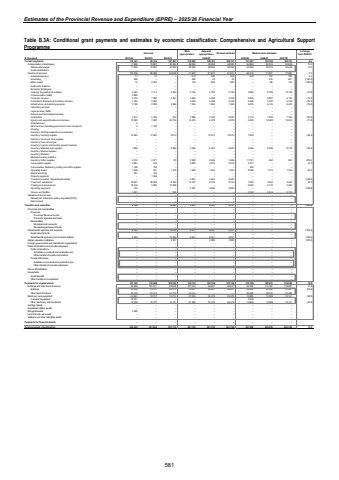
Estimates of the Provincial Revenue and Expenditure (EPRE) %u2013 2025/26 Financial YearTable B.3A: Conditional grant payments and estimates by economic classification: Comprehensive and Agricultural Support Programme Outcome Main appropriationAdjusted appropriation Revised estimate Medium-term estimates % change from 2024/25R thousand 2021/22 2022/23 2023/24 2025/26 2026/27 2027/28Current payments 98 316 115 141 107 897 119 882 129 701 129 701 137 481 122 195 129 701 6.0Compensation of employees 11 905 12 827 43 049 48 050 48 050 48 050 54 062 50 374 52 639 12.5Salaries and wages 11 905 12 827 43 049 48 050 48 050 48 050 54 062 50 374 52 639 12.5Social contributions %u2013 %u2013 %u2013 %u2013 %u2013 %u2013 %u2013 %u2013 %u2013Goods and services 103 236 85 489 64 848 71 832 81 651 81 651 83 419 71 821 77 062 2.2Administrative fees 71 15 %u2013 614 609 609 642 732 765 5.4Advertising 648 %u2013 %u2013 500 30 30 %u2013 575 601 (100.0)Minor assets 12 2 553 %u2013 105 806 806 %u2013 126 132 (100.0)Audit costs: External %u2013 %u2013 %u2013 %u2013 %u2013 %u2013 %u2013 %u2013 %u2013Bursaries: Employees %u2013 %u2013 %u2013 %u2013 %u2013 %u2013 %u2013 %u2013 %u2013Catering: Departmental activities 5 322 4 115 2 594 5 725 5 725 5 725 4 990 9 709 10 146 (12.8)Communication (G&S) 3 660 %u2013 %u2013 %u2013 %u2013 %u2013 %u2013 %u2013 %u2013Computer services 2 774 1 500 4 207 2 200 3 200 3 200 2 800 5 887 6 152 (12.5)Consultants: Business and advisory services 2 704 2 580 %u2013 5 328 5 328 5 328 2 848 5 330 5 570 (46.5)Infrastructure and planning services 3 158 2 302 4 986 7 369 7 659 7 659 6 239 6 145 6 422 (18.5)Laboratory services %u2013 %u2013 %u2013 %u2013 %u2013 %u2013 %u2013 %u2013 %u2013Legal services (G&S) %u2013 %u2013 %u2013 %u2013 %u2013 %u2013 %u2013 %u2013 %u2013Science and technological services %u2013 %u2013 %u2013 %u2013 %u2013 %u2013 %u2013 %u2013 %u2013Contractors 1 617 2 100 354 3 286 5 532 5 532 4 313 7 430 7 764 (22.0)Agency and support/outsourced services 12 582 7 600 20 735 14 475 6 278 6 278 5 200 12 983 15 574 (17.2)Entertainment 2 %u2013 %u2013 %u2013 %u2013 %u2013 %u2013 %u2013 %u2013Fleet services (including government motor transport) 4 7 120 %u2013 %u2013 %u2013 %u2013 %u2013 %u2013 %u2013Housing %u2013 %u2013 %u2013 %u2013 %u2013 %u2013 %u2013 %u2013 %u2013Inventory: Clothing material and accessories %u2013 %u2013 %u2013 %u2013 %u2013 %u2013 %u2013 %u2013 %u2013Inventory: Farming supplies 14 263 17 662 2 014 %u2013 12 272 12 272 7 800 %u2013 %u2013 (36.4)Inventory: Food and food supplies %u2013 %u2013 %u2013 %u2013 %u2013 %u2013 %u2013 %u2013 %u2013Inventory: Fuel, oil and gas %u2013 %u2013 %u2013 %u2013 %u2013 %u2013 %u2013 %u2013 %u2013Inventory: Learner and teacher support material %u2013 %u2013 %u2013 %u2013 %u2013 %u2013 %u2013 %u2013 %u2013Inventory: Materials and supplies 1 896 %u2013 6 968 4 935 6 043 6 043 4 269 8 400 8 778 (29.4)Inventory: Medical supplies %u2013 %u2013 %u2013 %u2013 %u2013 %u2013 %u2013 %u2013 %u2013Inventory: Medicine %u2013 %u2013 %u2013 %u2013 %u2013 %u2013 %u2013 %u2013 %u2013Medsas inventory interface %u2013 %u2013 %u2013 %u2013 %u2013 %u2013 %u2013 %u2013 %u2013Inventory: Other supplies 4 014 4 971 83 2 280 5 366 5 366 17 701 950 993 229.9Consumable supplies 2 881 516 %u2013 3 000 3 575 3 575 3 371 %u2013 %u2013 (5.7)Consumables: Stationery, printing and office supplies 1 198 100 %u2013 %u2013 %u2013 %u2013 350 %u2013 %u2013Operating leases 1 446 237 1 518 1 620 1 954 1 954 2 990 1 373 1 435 53.0Rental and hiring 201 145 %u2013 %u2013 %u2013 %u2013 %u2013 %u2013 %u2013Property payments %u2013 1 558 %u2013 %u2013 %u2013 %u2013 %u2013 %u2013 %u2013Transport provided: Departmental activity %u2013 %u2013 %u2013 5 901 6 464 6 464 %u2013 %u2013 %u2013 (100.0)Travel and subsistence 33 051 26 520 8 383 12 107 8 744 8 744 7 983 4 394 4 592 (8.7)Training and development 10 316 3 895 12 648 %u2013 %u2013 %u2013 9 595 5 172 5 405Operating payments 125 %u2013 %u2013 2 387 2 066 2 066 %u2013 %u2013 %u2013 (100.0)Venues and facilities 1 291 %u2013 358 %u2013 %u2013 %u2013 2 328 2 615 2 733Interest and rent on land %u2013 %u2013 %u2013 %u2013 %u2013 %u2013 %u2013 %u2013 %u2013Interest (Incl. interest on unitary payments (PPP)) %u2013 %u2013 %u2013 %u2013 %u2013 %u2013 %u2013 %u2013 %u2013Rent on land %u2013 %u2013 %u2013 %u2013 %u2013 %u2013 %u2013 %u2013 %u2013Transfers and subsidies 6 764 %u2013 19 823 6 551 9 351 9 351 %u2013 %u2013 %u2013 (100.0)Provinces and municipalities %u2013 %u2013 %u2013 %u2013 %u2013 %u2013 %u2013 %u2013 %u2013Provinces %u2013 %u2013 %u2013 %u2013 %u2013 %u2013 %u2013 %u2013 %u2013Provincial Revenue Funds %u2013 %u2013 %u2013 %u2013 %u2013 %u2013 %u2013 %u2013 %u2013Provincial agencies and funds %u2013 %u2013 %u2013 %u2013 %u2013 %u2013 %u2013 %u2013 %u2013Municipalities %u2013 %u2013 %u2013 %u2013 %u2013 %u2013 %u2013 %u2013 %u2013Municipal bank accounts %u2013 %u2013 %u2013 %u2013 %u2013 %u2013 %u2013 %u2013 %u2013Municipal agencies and funds %u2013 %u2013 %u2013 %u2013 %u2013 %u2013 %u2013 %u2013 %u2013Departmental agencies and accounts 6 764 %u2013 15 496 6 551 6 551 6 551 %u2013 %u2013 %u2013 (100.0)Social security funds %u2013 %u2013 %u2013 %u2013 %u2013 %u2013 %u2013 %u2013 %u2013Departmental agencies (non-business entities) 6 764 %u2013 15 496 6 551 6 551 6 551 %u2013 %u2013 %u2013 (100.0)Higher education institutions %u2013 %u2013 4 327 %u2013 2 800 2 800 %u2013 %u2013 %u2013 (100.0)Foreign governments and international organisations %u2013 %u2013 %u2013 %u2013 %u2013 %u2013 %u2013 %u2013 %u2013Public corporations and private enterprises %u2013 %u2013 %u2013 %u2013 %u2013 %u2013 %u2013 %u2013 %u2013Public corporations %u2013 %u2013 %u2013 %u2013 %u2013 %u2013 %u2013 %u2013 %u2013Subsidies on products and production (pc) %u2013 %u2013 %u2013 %u2013 %u2013 %u2013 %u2013 %u2013 %u2013Other transfers to public corporations %u2013 %u2013 %u2013 %u2013 %u2013 %u2013 %u2013 %u2013 %u2013Private enterprises %u2013 %u2013 %u2013 %u2013 %u2013 %u2013 %u2013 %u2013 %u2013Subsidies on products and production (pe) %u2013 %u2013 %u2013 %u2013 %u2013 %u2013 %u2013 %u2013 %u2013Other transfers to private enterprises %u2013 %u2013 %u2013 %u2013 %u2013 %u2013 %u2013 %u2013 %u2013Non-profit institutions %u2013 %u2013 %u2013 %u2013 %u2013 %u2013 %u2013 %u2013 %u2013Households %u2013 %u2013 %u2013 %u2013 %u2013 %u2013 %u2013 %u2013 %u2013Social benefits %u2013 %u2013 %u2013 %u2013 %u2013 %u2013 %u2013 %u2013 %u2013Other transfers to households %u2013 %u2013 %u2013 %u2013 %u2013 %u2013 %u2013 %u2013 %u2013Payments for capital assets 121 740 133 648 109 390 134 725 122 106 122 106 110 109 128 275 134 048 (9.8)Buildings and other fixed structures 93 699 122 911 93 658 107 242 96 627 96 627 94 304 113 767 118 887 (2.4)Buildings 44 284 79 757 69 279 72 697 96 627 96 627 68 804 64 552 67 457 (28.8)Other fixed structures 49 415 43 154 24 379 34 545 %u2013 %u2013 25 500 49 215 51 430Machinery and equipment 24 661 10 737 15 731 27 483 25 479 25 479 15 805 14 508 15 161 (38.0)Transport equipment 12 431 %u2013 %u2013 %u2013 %u2013 %u2013 2 000 %u2013 %u2013Other machinery and equipment 12 230 10 737 15 731 27 483 25 479 25 479 13 805 14 508 15 161 (45.8)Heritage Assets %u2013 %u2013 %u2013 %u2013 %u2013 %u2013 %u2013 %u2013 %u2013Specialised military assets %u2013 %u2013 %u2013 %u2013 %u2013 %u2013 %u2013 %u2013 %u2013Biological assets 3 380 %u2013 %u2013 %u2013 %u2013 %u2013 %u2013 %u2013 %u2013Land and sub-soil assets %u2013 %u2013 %u2013 %u2013 %u2013 %u2013 %u2013 %u2013 %u2013Software and other intangible assets %u2013 %u2013 %u2013 %u2013 %u2013 %u2013 %u2013 %u2013 %u2013Payments for financial assets %u2013 %u2013 %u2013 %u2013 %u2013 %u2013 %u2013 %u2013 %u2013Total economic classification 243 645 231 964 237 110 261 158 261 158 261 158 247 590 250 470 263 749 (5.2)2024/25581
