
Page 596 - Demo
P. 596
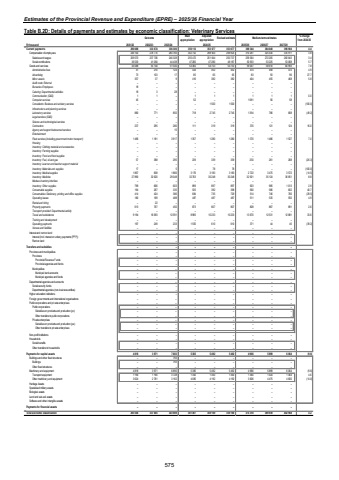
Estimates of the Provincial Revenue and Expenditure (EPRE) %u2013 2025/26 Financial YearTable B.2D: Details of payments and estimates by economic classification: Veterinary Services Outcome Main appropriationAdjusted appropriation Revised estimate Medium-term estimates % change from 2024/25R thousand 2021/22 2022/23 2023/24 2025/26 2026/27 2027/28Current payments 333 874 290 688 336 306 356 112 353 677 353 677 369 344 384 040 396 904 4.4Compensation of employees 246 100 278 770 284 766 302 752 298 924 298 924 310 297 325 430 335 911 3.8Salaries and wages 209 570 237 706 240 328 255 472 251 644 250 737 259 364 272 205 282 843 3.4Social contributions 36 530 41 064 44 438 47 280 47 280 48 187 50 933 53 225 53 068 5.7Goods and services 44 588 55 104 51 540 53 360 54 753 54 753 59 047 58 610 60 993 7.8Administrative fees 41 210 124 424 452 452 474 458 472 4.9Advertising 73 103 17 85 65 65 83 93 96 27.7Minor assets 357 37 9 416 382 382 404 455 468 5.8Audit costs: External %u2013 %u2013 %u2013 %u2013 %u2013 %u2013 %u2013 %u2013 %u2013Bursaries: Employees 18 %u2013 %u2013 %u2013 %u2013 %u2013 %u2013 %u2013 %u2013Catering: Departmental activities 18 3 28 %u2013 %u2013 %u2013 %u2013 %u2013 %u2013Communication (G&S) 1 1 %u2013 1 1 1 1 1 1 0.0Computer services 45 %u2013 %u2013 52 %u2013 %u2013 1 681 56 58Consultants: Business and advisory services %u2013 %u2013 %u2013 %u2013 1 500 1 500 %u2013 %u2013 %u2013 (100.0)Infrastructure and planning services %u2013 %u2013 %u2013 %u2013 %u2013 %u2013 %u2013 %u2013 %u2013Laboratory services 880 771 850 718 2 745 2 745 1 394 786 808 (49.2)Legal services (G&S) %u2013 %u2013 %u2013 %u2013 %u2013 %u2013 %u2013 %u2013 %u2013Science and technological services %u2013 %u2013 %u2013 %u2013 %u2013 %u2013 %u2013 %u2013 %u2013Contractors 237 295 280 111 319 319 370 121 124 16.0Agency and support/outsourced services %u2013 %u2013 15 %u2013 %u2013 %u2013 %u2013 %u2013 %u2013Entertainment %u2013 %u2013 %u2013 %u2013 %u2013 %u2013 %u2013 %u2013 %u2013Fleet services (including government motor transport) 1 496 1 181 3 917 1 357 1 280 1 280 1 370 1 486 1 527 7.0Housing %u2013 %u2013 %u2013 %u2013 %u2013 %u2013 %u2013 %u2013 %u2013Inventory: Clothing material and accessories %u2013 %u2013 %u2013 %u2013 %u2013 %u2013 %u2013 %u2013 %u2013Inventory: Farming supplies %u2013 %u2013 %u2013 %u2013 %u2013 %u2013 %u2013 %u2013 %u2013Inventory: Food and food supplies %u2013 %u2013 %u2013 %u2013 %u2013 %u2013 %u2013 %u2013 %u2013Inventory: Fuel, oil and gas 57 388 295 239 339 339 250 261 268 (26.3)Inventory: Learner and teacher support material %u2013 %u2013 %u2013 %u2013 %u2013 %u2013 %u2013 %u2013 %u2013Inventory: Materials and supplies 17 %u2013 5 %u2013 78 78 %u2013 %u2013 %u2013 (100.0)Inventory: Medical supplies 1 867 838 1 866 3 176 3 183 3 183 2 722 3 475 3 572 (14.5)Inventory: Medicine 27 890 32 620 29 048 32 763 30 248 30 248 32 921 35 124 36 851 8.8Medsas inventory interface %u2013 %u2013 %u2013 %u2013 %u2013 %u2013 %u2013 %u2013 %u2013Inventory: Other supplies 799 666 603 899 897 897 923 985 1 013 2.9Consumable supplies 194 267 335 535 392 398 560 586 602 40.7Consumables: Stationery, printing and office supplies 414 424 386 684 735 729 514 746 766 (29.5)Operating leases 180 169 488 487 487 487 511 535 550 4.9Rental and hiring %u2013 22 %u2013 %u2013 %u2013 %u2013 %u2013 %u2013 %u2013Property payments 613 767 450 873 807 807 828 867 891 2.6Transport provided: Departmental activity %u2013 %u2013 %u2013 %u2013 %u2013 %u2013 %u2013 %u2013 %u2013Travel and subsistence 9 194 16 093 12 591 8 985 10 233 10 233 13 670 12 531 12 881 33.6Training and development %u2013 %u2013 %u2013 %u2013 %u2013 %u2013 %u2013 %u2013 %u2013Operating payments 197 249 233 1 555 610 610 371 44 45 (39.2)Venues and facilities %u2013 %u2013 %u2013 %u2013 %u2013 %u2013 %u2013 %u2013 %u2013Interest and rent on land %u2013 %u2013 %u2013 %u2013 %u2013 %u2013 %u2013 %u2013 %u2013Interest (Incl. interest on unitary payments (PPP)) %u2013 %u2013 %u2013 %u2013 %u2013 %u2013 %u2013 %u2013 %u2013Rent on land %u2013 %u2013 %u2013 %u2013 %u2013 %u2013 %u2013 %u2013 %u2013Transfers and subsidies %u2013 %u2013 %u2013 %u2013 %u2013 %u2013 %u2013 %u2013 %u2013Provinces and municipalities %u2013 %u2013 %u2013 %u2013 %u2013 %u2013 %u2013 %u2013 %u2013Provinces %u2013 %u2013 %u2013 %u2013 %u2013 %u2013 %u2013 %u2013 %u2013Provincial Revenue Funds %u2013 %u2013 %u2013 %u2013 %u2013 %u2013 %u2013 %u2013 %u2013Provincial agencies and funds %u2013 %u2013 %u2013 %u2013 %u2013 %u2013 %u2013 %u2013 %u2013Municipalities %u2013 %u2013 %u2013 %u2013 %u2013 %u2013 %u2013 %u2013 %u2013Municipal bank accounts %u2013 %u2013 %u2013 %u2013 %u2013 %u2013 %u2013 %u2013 %u2013Municipal agencies and funds %u2013 %u2013 %u2013 %u2013 %u2013 %u2013 %u2013 %u2013 %u2013Departmental agencies and accounts %u2013 %u2013 %u2013 %u2013 %u2013 %u2013 %u2013 %u2013 %u2013Social security funds %u2013 %u2013 %u2013 %u2013 %u2013 %u2013 %u2013 %u2013 %u2013Departmental agencies (non-business entities) %u2013 %u2013 %u2013 %u2013 %u2013 %u2013 %u2013 %u2013 %u2013Higher education institutions %u2013 %u2013 %u2013 %u2013 %u2013 %u2013 %u2013 %u2013 %u2013Foreign governments and international organisations %u2013 %u2013 %u2013 %u2013 %u2013 %u2013 %u2013 %u2013 %u2013Public corporations and private enterprises %u2013 %u2013 %u2013 %u2013 %u2013 %u2013 %u2013 %u2013 %u2013Public corporations %u2013 %u2013 %u2013 %u2013 %u2013 %u2013 %u2013 %u2013 %u2013Subsidies on products and production (pc) %u2013 %u2013 %u2013 %u2013 %u2013 %u2013 %u2013 %u2013 %u2013Other transfers to public corporations %u2013 %u2013 %u2013 %u2013 %u2013 %u2013 %u2013 %u2013 %u2013Private enterprises %u2013 %u2013 %u2013 %u2013 %u2013 %u2013 %u2013 %u2013 %u2013Subsidies on products and production (pe) %u2013 %u2013 %u2013 %u2013 %u2013 %u2013 %u2013 %u2013 %u2013Other transfers to private enterprises %u2013 %u2013 %u2013 %u2013 %u2013 %u2013 %u2013 %u2013 %u2013Non-profit institutions %u2013 %u2013 %u2013 %u2013 %u2013 %u2013 %u2013 %u2013 %u2013Households %u2013 %u2013 %u2013 %u2013 %u2013 %u2013 %u2013 %u2013 %u2013Social benefits %u2013 %u2013 %u2013 %u2013 %u2013 %u2013 %u2013 %u2013 %u2013Other transfers to households %u2013 %u2013 %u2013 %u2013 %u2013 %u2013 %u2013 %u2013 %u2013Payments for capital assets 4 818 3 971 7 683 5 385 5 492 5 492 4 966 5 899 6 064 (9.6)Buildings and other fixed structures %u2013 %u2013 793 %u2013 %u2013 %u2013 %u2013 %u2013 %u2013Buildings %u2013 %u2013 793 %u2013 %u2013 %u2013 %u2013 %u2013 %u2013Other fixed structures %u2013 %u2013 %u2013 %u2013 %u2013 %u2013 %u2013 %u2013 %u2013Machinery and equipment 4 818 3 971 6 890 5 385 5 492 5 492 4 966 5 899 6 064 (9.6)Transport equipment 1 194 1 190 3 728 1 300 1 300 1 300 1 360 1 424 1 464 4.6Other machinery and equipment 3 624 2 781 3 162 4 085 4 192 4 192 3 606 4 475 4 600 (14.0)Heritage Assets %u2013 %u2013 %u2013 %u2013 %u2013 %u2013 %u2013 %u2013 %u2013Specialised military assets %u2013 %u2013 %u2013 %u2013 %u2013 %u2013 %u2013 %u2013 %u2013Biological assets %u2013 %u2013 %u2013 %u2013 %u2013 %u2013 %u2013 %u2013 %u2013Land and sub-soil assets %u2013 %u2013 %u2013 %u2013 %u2013 %u2013 %u2013 %u2013 %u2013Software and other intangible assets %u2013 %u2013 %u2013 %u2013 %u2013 %u2013 %u2013 %u2013 %u2013Payments for financial assets %u2013 %u2013 %u2013 %u2013 %u2013 %u2013 %u2013 %u2013 %u2013Total economic classification 295 506 337 845 343 989 361 497 359 169 359 169 374 310 389 939 402 968 4.22024/25575
