
Page 601 - Demo
P. 601
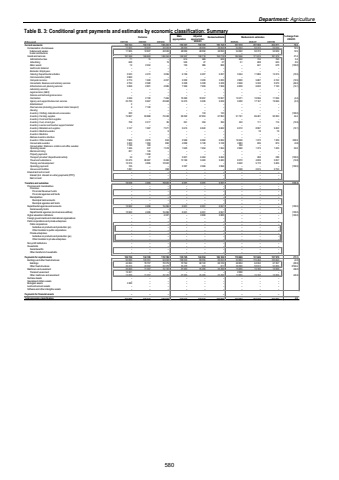
Department: AgricultureTable B. 3: Conditional grant payments and estimates by economic classification: Summary Outcome Main appropriationAdjusted appropriation Revised estimate Medium-term estimates % change from 2024/25R thousand 2021/22 2022/23 2023/24 2025/26 2026/27 2027/28Current payments 182 730 199 154 192 403 190 397 198 768 198 768 237 018 221 989 234 011 19.2Compensation of employees 11 905 12 827 43 049 48 050 48 050 48 050 54 062 50 374 52 639 12.5Salaries and wages 11 905 12 827 43 049 48 050 48 050 48 050 54 062 50 374 52 639 12.5Social contributions %u2013 %u2013 %u2013 %u2013 %u2013 %u2013 %u2013 %u2013 %u2013Goods and services 187 249 169 903 149 354 142 347 150 718 150 718 182 956 171 615 181 372 21.4Administrative fees 15 71 %u2013 614 609 609 642 732 765 5.4Advertising 648 %u2013 15 545 47 47 51 608 635 8.5Minor assets 12 2 553 %u2013 105 806 806 %u2013 641 670 (100.0)Audit costs: External %u2013 %u2013 %u2013 %u2013 %u2013 %u2013 %u2013 %u2013 %u2013Bursaries: Employees %u2013 %u2013 %u2013 %u2013 %u2013 %u2013 %u2013 %u2013 %u2013Catering: Departmental activities 4 473 5 533 3 096 6 109 6 207 6 207 5 554 11 880 12 415 (10.5)Communication (G&S) 3 660 %u2013 %u2013 %u2013 %u2013 %u2013 %u2013 %u2013 %u2013Computer services 1 500 2 774 4 207 2 200 3 200 3 200 2 800 5 887 6 152 (12.5)Consultants: Business and advisory services 2 580 2 704 %u2013 5 328 5 328 5 328 2 848 5 330 5 570 (46.5)Infrastructure and planning services 2 801 3 658 4 986 7 369 7 959 7 959 6 839 6 832 7 140 (14.1)Laboratory services %u2013 %u2013 %u2013 %u2013 %u2013 %u2013 %u2013 %u2013 %u2013Legal services (G&S) %u2013 %u2013 %u2013 %u2013 %u2013 %u2013 %u2013 %u2013 %u2013Science and technological services %u2013 %u2013 %u2013 %u2013 %u2013 %u2013 %u2013 %u2013 %u2013Contractors 2 100 4 249 7 466 10 490 10 957 10 957 10 471 10 556 11 036 (4.4)Agency and support/outsourced services 9 667 25 729 23 668 14 475 9 226 9 226 9 200 17 167 19 946 (0.3)Entertainment 2 %u2013 %u2013 %u2013 %u2013 %u2013 %u2013 %u2013 %u2013Fleet services (including government motor transport) 7 120 4 %u2013 %u2013 %u2013 %u2013 %u2013 %u2013 %u2013Housing %u2013 %u2013 %u2013 %u2013 %u2013 %u2013 %u2013 %u2013 %u2013Inventory: Clothing material and accessories 220 %u2013 %u2013 %u2013 133 133 %u2013 %u2013 %u2013 (100.0)Inventory: Farming supplies 93 888 74 997 73 248 59 392 67 853 67 853 91 191 86 481 90 393 34.4Inventory: Food and food supplies %u2013 %u2013 %u2013 %u2013 %u2013 %u2013 %u2013 %u2013 %u2013Inventory: Fuel, oil and gas 2 417 728 85 361 394 394 343 111 116 (12.9)Inventory: Learner and teacher support material %u2013 %u2013 %u2013 %u2013 %u2013 %u2013 %u2013 %u2013 %u2013Inventory: Materials and supplies 1 587 3 147 7 571 5 615 6 842 6 842 6 012 8 997 9 402 (12.1)Inventory: Medical supplies %u2013 %u2013 6 %u2013 %u2013 %u2013 %u2013 18 19Inventory: Medicine %u2013 %u2013 %u2013 %u2013 %u2013 %u2013 %u2013 %u2013 %u2013Medsas inventory interface %u2013 %u2013 %u2013 %u2013 %u2013 %u2013 %u2013 %u2013 %u2013Inventory: Other supplies 4 979 7 605 834 2 568 6 062 6 062 18 240 1 272 1 329 200.9Consumable supplies 1 284 3 422 890 4 099 5 128 5 128 4 883 836 874 (4.8)Consumables: Stationery, printing and office supplies 100 1 198 %u2013 %u2013 %u2013 %u2013 350 %u2013 %u2013Operating leases 237 1 446 1 518 1 620 1 954 1 954 2 990 1 373 1 435 53.0Rental and hiring 145 201 %u2013 %u2013 %u2013 %u2013 %u2013 %u2013 %u2013Property payments %u2013 1 558 %u2013 %u2013 %u2013 %u2013 %u2013 %u2013 %u2013Transport provided: Departmental activity 37 34 %u2013 5 901 6 464 6 464 %u2013 268 280 (100.0)Travel and subsistence 26 967 33 475 8 484 13 169 9 483 9 483 8 272 4 839 5 057 (12.8)Training and development 3 895 10 316 12 922 %u2013 %u2013 %u2013 9 942 5 172 5 405Operating payments 125 %u2013 %u2013 2 387 2 066 2 066 %u2013 %u2013 %u2013 (100.0)Venues and facilities 1 291 %u2013 358 %u2013 %u2013 %u2013 2 328 2 615 2 733Interest and rent on land %u2013 %u2013 %u2013 %u2013 %u2013 %u2013 %u2013 %u2013 %u2013Interest (Incl. interest on unitary payments (PPP)) %u2013 %u2013 %u2013 %u2013 %u2013 %u2013 %u2013 %u2013 %u2013Rent on land %u2013 %u2013 %u2013 %u2013 %u2013 %u2013 %u2013 %u2013 %u2013Transfers and subsidies 10 932 4 206 19 823 6 551 9 351 9 351 %u2013 %u2013 %u2013 (100.0)Provinces and municipalities %u2013 %u2013 %u2013 %u2013 %u2013 %u2013 %u2013 %u2013 %u2013Provinces %u2013 %u2013 %u2013 %u2013 %u2013 %u2013 %u2013 %u2013 %u2013Provincial Revenue Funds %u2013 %u2013 %u2013 %u2013 %u2013 %u2013 %u2013 %u2013 %u2013Provincial agencies and funds %u2013 %u2013 %u2013 %u2013 %u2013 %u2013 %u2013 %u2013 %u2013Municipalities %u2013 %u2013 %u2013 %u2013 %u2013 %u2013 %u2013 %u2013 %u2013Municipal bank accounts %u2013 %u2013 %u2013 %u2013 %u2013 %u2013 %u2013 %u2013 %u2013Municipal agencies and funds %u2013 %u2013 %u2013 %u2013 %u2013 %u2013 %u2013 %u2013 %u2013Departmental agencies and accounts 10 932 4 206 15 496 6 551 6 551 6 551 %u2013 %u2013 %u2013 (100.0)Social security funds %u2013 %u2013 %u2013 %u2013 %u2013 %u2013 %u2013 %u2013 %u2013Departmental agencies (non-business entities) 10 932 4 206 15 496 6 551 6 551 6 551 %u2013 %u2013 %u2013 (100.0)Higher education institutions %u2013 %u2013 4 327 %u2013 2 800 2 800 %u2013 %u2013 %u2013 (100.0)Foreign governments and international organisations %u2013 %u2013 %u2013 %u2013 %u2013 %u2013 %u2013 %u2013 %u2013Public corporations and private enterprises %u2013 %u2013 %u2013 %u2013 %u2013 %u2013 %u2013 %u2013 %u2013Public corporations %u2013 %u2013 %u2013 %u2013 %u2013 %u2013 %u2013 %u2013 %u2013Subsidies on products and production (pc) %u2013 %u2013 %u2013 %u2013 %u2013 %u2013 %u2013 %u2013 %u2013Other transfers to public corporations %u2013 %u2013 %u2013 %u2013 %u2013 %u2013 %u2013 %u2013 %u2013Private enterprises %u2013 %u2013 %u2013 %u2013 %u2013 %u2013 %u2013 %u2013 %u2013Subsidies on products and production (pe) %u2013 %u2013 %u2013 %u2013 %u2013 %u2013 %u2013 %u2013 %u2013Other transfers to private enterprises %u2013 %u2013 %u2013 %u2013 %u2013 %u2013 %u2013 %u2013 %u2013Non-profit institutions %u2013 %u2013 %u2013 %u2013 %u2013 %u2013 %u2013 %u2013 %u2013Households %u2013 %u2013 %u2013 %u2013 %u2013 %u2013 %u2013 %u2013 %u2013Social benefits %u2013 %u2013 %u2013 %u2013 %u2013 %u2013 %u2013 %u2013 %u2013Other transfers to households %u2013 %u2013 %u2013 %u2013 %u2013 %u2013 %u2013 %u2013 %u2013Payments for capital assets 122 739 134 708 110 789 135 725 124 554 124 532 110 669 131 646 137 570 (11.1)Buildings and other fixed structures 93 699 123 351 94 658 108 242 99 055 99 033 94 864 115 466 120 662 (4.2)Buildings 79 757 44 284 70 279 72 764 98 122 98 122 68 804 64 552 67 457 (29.9)Other fixed structures 49 415 43 594 24 379 35 478 933 911 26 060 50 914 53 205 2760.6Machinery and equipment 25 660 11 357 16 130 27 483 25 499 25 499 15 805 16 180 16 908 (38.0)Transport equipment 12 431 %u2013 %u2013 %u2013 %u2013 %u2013 2 000 %u2013 %u2013Other machinery and equipment 13 229 11 357 16 130 27 483 25 499 25 499 13 805 16 180 16 908 (45.9)Heritage Assets %u2013 %u2013 %u2013 %u2013 %u2013 %u2013 %u2013 %u2013 %u2013Specialised military assets %u2013 %u2013 %u2013 %u2013 %u2013 %u2013 %u2013 %u2013 %u2013Biological assets 3 380 %u2013 %u2013 %u2013 %u2013 %u2013 %u2013 %u2013 %u2013Land and sub-soil assets %u2013 %u2013 %u2013 %u2013 %u2013 %u2013 %u2013 %u2013 %u2013Software and other intangible assets %u2013 %u2013 %u2013 %u2013 %u2013 %u2013 %u2013 %u2013 %u2013Payments for financial assets %u2013 %u2013 %u2013 %u2013 %u2013 %u2013 %u2013 %u2013 %u2013Total economic classification 321 644 332 825 323 015 332 673 332 673 332 651 347 687 353 635 371 581 4.52024/25580
