
Page 597 - Demo
P. 597
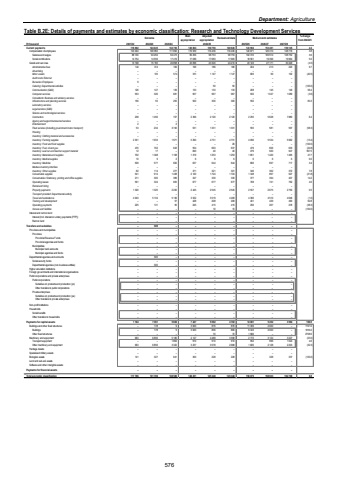
Department: AgricultureTable B.2E: Details of payments and estimates by economic classification: Research and Technology Development Services Outcome Main appropriationAdjusted appropriation Revised estimate Medium-term estimates % change from 2024/25R thousand 2021/22 2022/23 2023/24 2025/26 2026/27 2027/28Current payments 124 045 116 692 132 750 140 804 139 756 140 646 143 994 153 481 159 145 2.4Compensation of employees 103 494 108 850 111 892 116 939 116 436 116 436 120 871 126 310 128 716 3.8Salaries and wages 88 740 94 294 94 473 99 256 98 753 98 753 102 310 106 914 108 752 3.6Social contributions 14 754 14 556 17 419 17 683 17 683 17 683 18 561 19 396 19 964 5.0Goods and services 13 198 15 195 20 858 23 865 23 320 24 210 23 123 27 171 30 429 (4.5)Administrative fees 314 144 184 196 186 186 204 213 220 9.7Advertising %u2013 %u2013 %u2013 %u2013 %u2013 %u2013 %u2013 %u2013 %u2013 Minor assets 135 %u2013 574 351 1 147 1 147 683 99 102 (40.5)Audit costs: External %u2013 %u2013 %u2013 %u2013 %u2013 %u2013 %u2013 %u2013 %u2013Bursaries: Employees 9 %u2013 %u2013 %u2013 %u2013 %u2013 %u2013 %u2013 %u2013Catering: Departmental activities %u2013 %u2013 %u2013 %u2013 50 50 %u2013 %u2013 %u2013 (100.0)Communication (G&S) 126 147 139 133 133 133 208 145 149 56.4Computer services 553 326 681 957 967 967 932 1 047 1 089 (3.6)Consultants: Business and advisory services %u2013 %u2013 %u2013 %u2013 %u2013 %u2013 %u2013 %u2013 %u2013Infrastructure and planning services 156 55 255 500 300 300 550 %u2013 %u2013 83.3Laboratory services %u2013 %u2013 %u2013 %u2013 %u2013 %u2013 %u2013 %u2013 %u2013Legal services (G&S) %u2013 %u2013 %u2013 %u2013 %u2013 %u2013 %u2013 %u2013 %u2013Science and technological services %u2013 %u2013 %u2013 %u2013 %u2013 %u2013 %u2013 %u2013 %u2013Contractors 238 1 456 727 2 396 2 120 2 120 2 255 5 628 7 880 6.4Agency and support/outsourced services %u2013 %u2013 %u2013 %u2013 %u2013 %u2013 %u2013 %u2013 %u2013Entertainment 2 %u2013 2 %u2013 %u2013 %u2013 %u2013 %u2013 %u2013Fleet services (including government motor transport) 53 234 3 745 531 1 331 1 331 555 581 597 (58.3)Housing %u2013 %u2013 %u2013 %u2013 %u2013 %u2013 %u2013 %u2013 %u2013Inventory: Clothing material and accessories %u2013 %u2013 %u2013 %u2013 %u2013 %u2013 %u2013 %u2013 %u2013Inventory: Farming supplies 2 301 1 933 1 971 5 290 4 731 4 731 4 096 5 534 5 962 (13.4)Inventory: Food and food supplies %u2013 %u2013 %u2013 %u2013 %u2013 26 %u2013 %u2013 %u2013 (100.0)Inventory: Fuel, oil and gas 470 702 643 554 663 637 479 606 633 (24.8)Inventory: Learner and teacher support material 12 17 %u2013 840 40 40 279 920 947 597.5Inventory: Materials and supplies 702 1 048 1 108 1 319 1 253 1 253 1 851 1 420 1 495 47.7Inventory: Medical supplies 10 9 2 6 6 6 6 6 6 0.0Inventory: Medicine 509 577 600 637 644 644 666 697 717 3.4Medsas inventory interface %u2013 %u2013 %u2013 %u2013 %u2013 %u2013 %u2013 %u2013 %u2013Inventory: Other supplies 82 114 277 371 321 321 346 362 372 7.8Consumable supplies 541 914 1 438 2 120 1 724 1 724 1 348 897 927 (21.8)Consumables: Stationery, printing and office supplies 211 300 389 347 330 330 377 394 407 14.2Operating leases 591 324 605 677 677 677 708 741 762 4.6Rental and hiring %u2013 %u2013 %u2013 %u2013 %u2013 %u2013 %u2013 %u2013 %u2013Property payments 1 320 1 325 2 230 2 445 2 545 2 545 2 557 2 675 2 750 0.5Transport provided: Departmental activity %u2013 %u2013 %u2013 %u2013 %u2013 %u2013 %u2013 %u2013 %u2013Travel and subsistence 4 943 5 134 5 136 3 522 3 519 4 409 4 366 4 510 4 646 (1.0)Training and development %u2013 %u2013 57 428 208 208 401 429 490 92.8Operating payments 225 131 95 245 415 415 256 267 278 (38.3)Venues and facilities %u2013 %u2013 %u2013 %u2013 10 10 %u2013 %u2013 %u2013 (100.0)Interest and rent on land %u2013 %u2013 %u2013 %u2013 %u2013 %u2013 %u2013 %u2013 %u2013Interest (Incl. interest on unitary payments (PPP)) %u2013 %u2013 %u2013 %u2013 %u2013 %u2013 %u2013 %u2013 %u2013Rent on land %u2013 %u2013 %u2013 %u2013 %u2013 %u2013 %u2013 %u2013 %u2013Transfers and subsidies %u2013 300 %u2013 %u2013 %u2013 %u2013 %u2013 %u2013 %u2013Provinces and municipalities %u2013 %u2013 %u2013 %u2013 %u2013 %u2013 %u2013 %u2013 %u2013Provinces %u2013 %u2013 %u2013 %u2013 %u2013 %u2013 %u2013 %u2013 %u2013Provincial Revenue Funds %u2013 %u2013 %u2013 %u2013 %u2013 %u2013 %u2013 %u2013 %u2013Provincial agencies and funds %u2013 %u2013 %u2013 %u2013 %u2013 %u2013 %u2013 %u2013 %u2013Municipalities %u2013 %u2013 %u2013 %u2013 %u2013 %u2013 %u2013 %u2013 %u2013Municipal bank accounts %u2013 %u2013 %u2013 %u2013 %u2013 %u2013 %u2013 %u2013 %u2013Municipal agencies and funds %u2013 %u2013 %u2013 %u2013 %u2013 %u2013 %u2013 %u2013 %u2013Departmental agencies and accounts %u2013 300 %u2013 %u2013 %u2013 %u2013 %u2013 %u2013 %u2013Social security funds %u2013 %u2013 %u2013 %u2013 %u2013 %u2013 %u2013 %u2013 %u2013Departmental agencies (non-business entities) %u2013 300 %u2013 %u2013 %u2013 %u2013 %u2013 %u2013 %u2013Higher education institutions %u2013 %u2013 %u2013 %u2013 %u2013 %u2013 %u2013 %u2013 %u2013Foreign governments and international organisations %u2013 %u2013 %u2013 %u2013 %u2013 %u2013 %u2013 %u2013 %u2013Public corporations and private enterprises %u2013 %u2013 %u2013 %u2013 %u2013 %u2013 %u2013 %u2013 %u2013Public corporations %u2013 %u2013 %u2013 %u2013 %u2013 %u2013 %u2013 %u2013 %u2013Subsidies on products and production (pc) %u2013 %u2013 %u2013 %u2013 %u2013 %u2013 %u2013 %u2013 %u2013Other transfers to public corporations %u2013 %u2013 %u2013 %u2013 %u2013 %u2013 %u2013 %u2013 %u2013Private enterprises %u2013 %u2013 %u2013 %u2013 %u2013 %u2013 %u2013 %u2013 %u2013Subsidies on products and production (pe) %u2013 %u2013 %u2013 %u2013 %u2013 %u2013 %u2013 %u2013 %u2013Other transfers to private enterprises %u2013 %u2013 %u2013 %u2013 %u2013 %u2013 %u2013 %u2013 %u2013Non-profit institutions %u2013 %u2013 %u2013 %u2013 %u2013 %u2013 %u2013 %u2013 %u2013Households %u2013 %u2013 %u2013 %u2013 %u2013 %u2013 %u2013 %u2013 %u2013Social benefits %u2013 %u2013 %u2013 %u2013 %u2013 %u2013 %u2013 %u2013 %u2013Other transfers to households %u2013 %u2013 %u2013 %u2013 %u2013 %u2013 %u2013 %u2013 %u2013Payments for capital assets 1 104 7 361 5 836 7 447 5 592 4 702 14 081 5 452 3 564 199.5Buildings and other fixed structures %u2013 178 9 3 000 876 876 11 309 2 000 %u2013 1191.0Buildings %u2013 178 9 3 000 806 806 9 343 2 000 %u2013 1059.2Other fixed structures %u2013 %u2013 %u2013 %u2013 70 70 1 966 %u2013 %u2013 2708.6Machinery and equipment 963 6 856 5 186 4 147 4 488 3 598 2 772 3 124 3 227 (23.0)Transport equipment %u2013 %u2013 1 864 910 910 910 952 996 1 024 4.6Other machinery and equipment 963 6 856 3 322 3 237 3 578 2 688 1 820 2 128 2 203 (32.3)Heritage Assets %u2013 %u2013 %u2013 %u2013 %u2013 %u2013 %u2013 %u2013 %u2013Specialised military assets %u2013 %u2013 %u2013 %u2013 %u2013 %u2013 %u2013 %u2013 %u2013Biological assets 141 327 641 300 228 228 %u2013 328 337 (100.0)Land and sub-soil assets %u2013 %u2013 %u2013 %u2013 %u2013 %u2013 %u2013 %u2013 %u2013Software and other intangible assets %u2013 %u2013 %u2013 %u2013 %u2013 %u2013 %u2013 %u2013 %u2013Payments for financial assets %u2013 %u2013 %u2013 %u2013 %u2013 %u2013 %u2013 %u2013 %u2013Total economic classification 117 796 131 706 138 586 148 251 145 348 145 348 158 075 158 933 162 709 8.82024/25576
