
Page 599 - Demo
P. 599
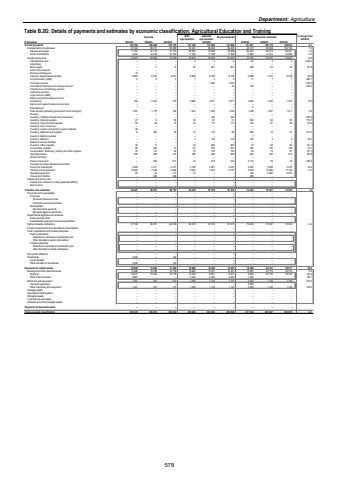
Department: AgricultureTable B.2G: Details of payments and estimates by economic classification: Agricultural Education and Training Outcome Main appropriationAdjusted appropriation Revised estimate Medium-term estimates % change from 2024/25R thousand 2021/22 2022/23 2023/24 2025/26 2026/27 2027/28Current payments 108 099 104 769 105 185 121 126 121 858 121 858 127 621 128 179 136 879 4.7Compensation of employees 81 342 83 217 85 960 91 451 89 456 89 456 96 127 98 928 103 195 7.5Salaries and wages 71 787 72 712 73 776 80 093 78 098 78 098 84 247 86 513 90 297 7.9Social contributions 9 555 10 505 12 184 11 358 11 358 11 358 11 880 12 415 12 898 4.6Goods and services 23 427 24 882 19 225 29 675 32 402 32 402 31 494 29 251 33 684 (2.8)Administrative fees %u2013 %u2013 %u2013 4 4 4 44 4 4 1000.0Advertising %u2013 %u2013 %u2013 %u2013 %u2013 %u2013 %u2013 %u2013 %u2013Minor assets %u2013 2 13 30 801 801 386 32 33 (51.8)Audit costs: External %u2013 %u2013 %u2013 %u2013 %u2013 %u2013 %u2013 %u2013 %u2013Bursaries: Employees 15 %u2013 %u2013 %u2013 %u2013 %u2013 %u2013 %u2013 %u2013Catering: Departmental activities 6 847 8 663 4 977 8 828 8 728 8 728 6 990 5 723 6 338 (19.9)Communication (G&S) 5 2 3 7 3 3 11 7 7 266.7Computer services %u2013 %u2013 %u2013 %u2013 1 000 1 000 %u2013 %u2013 %u2013 (100.0)Consultants: Business and advisory services %u2013 %u2013 %u2013 %u2013 %u2013 44 150 %u2013 %u2013 240.9Infrastructure and planning services %u2013 %u2013 %u2013 %u2013 %u2013 %u2013 %u2013 %u2013 %u2013Laboratory services %u2013 %u2013 %u2013 %u2013 %u2013 %u2013 %u2013 %u2013 %u2013Legal services (G&S) %u2013 %u2013 %u2013 %u2013 %u2013 %u2013 %u2013 %u2013 %u2013Science and technological services %u2013 %u2013 %u2013 %u2013 %u2013 %u2013 %u2013 %u2013 %u2013Contractors 2 524 346 519 3 846 4 671 4 671 4 282 1 833 1 916 (8.3)Agency and support/outsourced services %u2013 %u2013 %u2013 %u2013 %u2013 %u2013 %u2013 %u2013 %u2013Entertainment 1 %u2013 %u2013 %u2013 %u2013 %u2013 6 %u2013 %u2013Fleet services (including government motor transport) 1 770 1 057 160 1 432 1 432 1 432 1 498 1 567 1 611 4.6Housing %u2013 %u2013 %u2013 %u2013 %u2013 %u2013 %u2013 %u2013 %u2013Inventory: Clothing material and accessories %u2013 %u2013 %u2013 %u2013 450 450 %u2013 %u2013 %u2013 (100.0)Inventory: Farming supplies 6 27 26 76 61 61 500 83 85 719.7Inventory: Food and food supplies 29 59 73 79 117 117 100 87 89 (14.5)Inventory: Fuel, oil and gas %u2013 %u2013 %u2013 %u2013 %u2013 %u2013 %u2013 %u2013 %u2013Inventory: Learner and teacher support material 30 %u2013 %u2013 %u2013 %u2013 %u2013 %u2013 %u2013 %u2013Inventory: Materials and supplies 520 6 32 73 113 69 256 79 81 271.0Inventory: Medical supplies %u2013 %u2013 %u2013 %u2013 %u2013 %u2013 7 %u2013 %u2013Inventory: Medicine %u2013 %u2013 %u2013 3 103 103 150 3 3 45.6Medsas inventory interface %u2013 %u2013 %u2013 %u2013 %u2013 %u2013 %u2013 %u2013 %u2013Inventory: Other supplies 11 36 %u2013 76 883 883 79 83 85 (91.1)Consumable supplies 432 86 41 97 672 672 780 105 108 16.1Consumables: Stationery, printing and office supplies 141 73 40 73 123 123 84 79 81 (31.7)Operating leases 228 288 213 368 598 598 385 403 414 (35.6)Rental and hiring %u2013 %u2013 %u2013 %u2013 %u2013 %u2013 %u2013 %u2013 %u2013Property payments %u2013 520 817 70 519 519 2 119 76 78 308.3Transport provided: Departmental activity %u2013 %u2013 %u2013 %u2013 %u2013 %u2013 %u2013 %u2013 %u2013Travel and subsistence 4 517 2 363 3 577 4 728 4 801 5 337 6 225 2 506 2 576 16.6Training and development 10 366 7 038 8 259 9 813 7 323 6 787 6 942 13 686 17 199 2.3Operating payments 26 69 117 72 %u2013 %u2013 100 2 895 2 976Venues and facilities %u2013 206 358 %u2013 %u2013 %u2013 400 %u2013 %u2013Interest and rent on land %u2013 %u2013 %u2013 %u2013 %u2013 %u2013 %u2013 %u2013 %u2013Interest (Incl. interest on unitary payments (PPP)) %u2013 %u2013 %u2013 %u2013 %u2013 %u2013 %u2013 %u2013 %u2013Rent on land %u2013 %u2013 %u2013 %u2013 %u2013 %u2013 %u2013 %u2013 %u2013Transfers and subsidies 63 427 59 051 66 157 64 479 67 279 67 279 70 245 70 547 72 522 4.4 Provinces and municipalities %u2013 %u2013 %u2013 %u2013 %u2013 %u2013 %u2013 %u2013 %u2013Provinces %u2013 %u2013 %u2013 %u2013 %u2013 %u2013 %u2013 %u2013 %u2013Provincial Revenue Funds %u2013 %u2013 %u2013 %u2013 %u2013 %u2013 %u2013 %u2013 %u2013Provincial agencies and funds %u2013 %u2013 %u2013 %u2013 %u2013 %u2013 %u2013 %u2013 %u2013Municipalities %u2013 %u2013 %u2013 %u2013 %u2013 %u2013 %u2013 %u2013 %u2013Municipal bank accounts %u2013 %u2013 %u2013 %u2013 %u2013 %u2013 %u2013 %u2013 %u2013Municipal agencies and funds %u2013 %u2013 %u2013 %u2013 %u2013 %u2013 %u2013 %u2013 %u2013Departmental agencies and accounts %u2013 %u2013 %u2013 %u2013 %u2013 %u2013 %u2013 %u2013 %u2013Social security funds %u2013 %u2013 %u2013 %u2013 %u2013 %u2013 %u2013 %u2013 %u2013Departmental agencies (non-business entities) %u2013 %u2013 %u2013 %u2013 %u2013 %u2013 %u2013 %u2013 %u2013Higher education institutions 61 198 59 051 66 035 64 479 67 279 67 279 70 245 70 547 72 522 4.4Foreign governments and international organisations %u2013 %u2013 %u2013 %u2013 %u2013 %u2013 %u2013 %u2013 %u2013Public corporations and private enterprises %u2013 %u2013 %u2013 %u2013 %u2013 %u2013 %u2013 %u2013 %u2013Public corporations %u2013 %u2013 %u2013 %u2013 %u2013 %u2013 %u2013 %u2013 %u2013Subsidies on products and production (pc) %u2013 %u2013 %u2013 %u2013 %u2013 %u2013 %u2013 %u2013 %u2013Other transfers to public corporations %u2013 %u2013 %u2013 %u2013 %u2013 %u2013 %u2013 %u2013 %u2013Private enterprises %u2013 %u2013 %u2013 %u2013 %u2013 %u2013 %u2013 %u2013 %u2013Subsidies on products and production (pe) %u2013 %u2013 %u2013 %u2013 %u2013 %u2013 %u2013 %u2013 %u2013Other transfers to private enterprises %u2013 %u2013 %u2013 %u2013 %u2013 %u2013 %u2013 %u2013 %u2013Non-profit institutions %u2013 %u2013 %u2013 %u2013 %u2013 %u2013 %u2013 %u2013 %u2013Households 2 229 %u2013 122 %u2013 %u2013 %u2013 %u2013 %u2013 %u2013Social benefits %u2013 %u2013 %u2013 %u2013 %u2013 %u2013 %u2013 %u2013 %u2013Other transfers to households 2 229 %u2013 122 %u2013 %u2013 %u2013 %u2013 %u2013 %u2013Payments for capital assets 16 949 13 665 17 492 19 890 14 363 14 363 19 328 24 321 24 517 34.6Buildings and other fixed structures 15 498 13 238 16 718 18 840 13 241 13 241 14 032 23 175 23 319 6.0Buildings 13 238 10 617 16 718 14 420 8 821 8 821 6 600 23 175 23 319 (25.2)Other fixed structures 4 881 %u2013 %u2013 4 420 4 420 4 420 7 432 %u2013 %u2013 68.1Machinery and equipment 1 451 427 774 1 050 1 122 1 122 5 296 1 146 1 198 372.0Transport equipment %u2013 %u2013 %u2013 %u2013 %u2013 %u2013 2 000 %u2013 %u2013Other machinery and equipment 1 451 427 774 1 050 1 122 1 122 3 296 1 146 1 198 193.8Heritage Assets %u2013 %u2013 %u2013 %u2013 %u2013 %u2013 %u2013 %u2013 %u2013Specialised military assets %u2013 %u2013 %u2013 %u2013 %u2013 %u2013 %u2013 %u2013 %u2013Biological assets %u2013 %u2013 %u2013 %u2013 %u2013 %u2013 %u2013 %u2013 %u2013Land and sub-soil assets %u2013 %u2013 %u2013 %u2013 %u2013 %u2013 %u2013 %u2013 %u2013Software and other intangible assets %u2013 %u2013 %u2013 %u2013 %u2013 %u2013 %u2013 %u2013 %u2013Payments for financial assets %u2013 %u2013 %u2013 %u2013 %u2013 %u2013 %u2013 %u2013 %u2013Total economic classification 180 815 185 145 188 834 205 495 203 500 203 500 217 194 223 047 233 918 6.72024/25578
