
Page 647 - Demo
P. 647
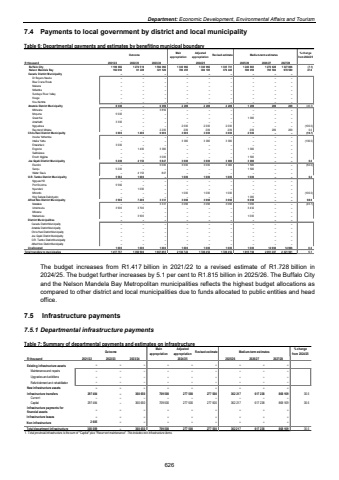
Department: Economic Development, Environmental Affairs and Tourism 7.4 Payments to local government by district and local municipality Table 6: Departmental payments and estimates by benefiting municipal boundary Outcome Main appropriationAdjusted appropriation Revised estimate Medium-term estimates % change from 2024/25R thousand 2021/22 2022/23 2023/24 2025/26 2026/27 2027/28 Buffalo City 1 199 082 1 274 519 1 594 092 1 330 992 1 330 992 1 335 731 1 240 893 1 270 628 1 327 806 (7.1) Nelson Mandela Bay 192 093 61 228 321 526 786 455 384 185 379 446 560 056 765 584 978 580 47.6Cacadu District Municipality %u2013 %u2013 %u2013 %u2013 %u2013 %u2013 %u2013 %u2013 %u2013 Dr Beyers Naude %u2013 %u2013 %u2013 %u2013 %u2013 %u2013 %u2013 %u2013 %u2013 Blue Crane Route %u2013 %u2013 %u2013 %u2013 %u2013 %u2013 %u2013 %u2013 %u2013 Makana %u2013 %u2013 %u2013 %u2013 %u2013 %u2013 %u2013 %u2013 %u2013 Ndlambe %u2013 %u2013 %u2013 %u2013 %u2013 %u2013 %u2013 %u2013 %u2013 Sundays River Valley %u2013 %u2013 %u2013 %u2013 %u2013 %u2013 %u2013 %u2013 %u2013 Kouga %u2013 %u2013 %u2013 %u2013 %u2013 %u2013 %u2013 %u2013 %u2013 Kou-Kamma %u2013 %u2013 %u2013 %u2013 %u2013 %u2013 %u2013 %u2013 %u2013 Amatole District Municipality 8 300 %u2013 6 059 2 209 2 209 2 209 1 209 209 209 (45.3) Mbhashe %u2013 %u2013 3 859 %u2013 %u2013 %u2013 %u2013 %u2013 %u2013 Mnquma 5 000 %u2013 %u2013 %u2013 %u2013 %u2013 %u2013 %u2013 %u2013 Great Kei %u2013 %u2013 %u2013 %u2013 %u2013 %u2013 1 000 %u2013 %u2013 Amahlathi 3 300 %u2013 %u2013 %u2013 %u2013 %u2013 %u2013 %u2013 %u2013 Ngqushwa %u2013 %u2013 %u2013 2 000 2 000 2 000 %u2013 %u2013 (100.0) %u2013 Raymond Mhlaba %u2013 %u2013 2 200 209 209 209 209 209 209 0.0Chris Hani District Municipality 3 000 1 400 6 000 3 000 3 000 3 000 2 500 %u2013 (16.7) %u2013 Inxuba Yethemba %u2013 %u2013 %u2013 %u2013 %u2013 %u2013 %u2013 %u2013 %u2013 Intsika Yethu %u2013 %u2013 %u2013 3 000 3 000 3 000 %u2013 %u2013 (100.0) %u2013 Emalahleni 3 000 %u2013 %u2013 %u2013 %u2013 %u2013 %u2013 %u2013 %u2013 Engcobo %u2013 1 400 3 000 %u2013 %u2013 %u2013 1 000 %u2013 %u2013 Sakhisizwe %u2013 %u2013 %u2013 %u2013 %u2013 %u2013 %u2013 %u2013 %u2013 Enoch Mgijima %u2013 %u2013 3 000 %u2013 %u2013 %u2013 1 500 %u2013 %u2013 Joe Gqabi District Municipality 5 200 4 153 5 847 3 000 3 000 3 000 3 000 %u2013 %u2013 0.0 Elundini %u2013 %u2013 5 000 3 000 3 000 3 000 1 500 %u2013 (50.0) %u2013 Senqu 5 200 %u2013 %u2013 %u2013 %u2013 %u2013 1 500 %u2013 %u2013 Walter Sisulu %u2013 4 153 847 %u2013 %u2013 %u2013 %u2013 %u2013 %u2013 O.R. Tambo District Municipality 5 582 1 000 %u2013 1 000 1 000 1 000 1 000 %u2013 %u2013 0.0 Ngquza Hill %u2013 %u2013 %u2013 %u2013 %u2013 %u2013 %u2013 %u2013 %u2013 Port St Johns 5 582 %u2013 %u2013 %u2013 %u2013 %u2013 %u2013 %u2013 %u2013 Nyandeni %u2013 1 000 %u2013 %u2013 %u2013 %u2013 %u2013 %u2013 %u2013 Mhlontlo %u2013 %u2013 %u2013 1 000 1 000 1 000 %u2013 %u2013 (100.0) %u2013 King Sabata Dalindyebo %u2013 %u2013 %u2013 %u2013 %u2013 %u2013 1 000 %u2013 %u2013 Alfred Nzo District Municipality 3 500 7 200 3 331 3 066 3 066 3 066 6 098 %u2013 %u2013 98.9 Matatiele %u2013 %u2013 3 331 3 066 3 066 3 066 1 666 %u2013 (45.7) %u2013 Umzimvubu 3 500 3 700 %u2013 %u2013 %u2013 %u2013 3 432 %u2013 %u2013 Mbizana %u2013 %u2013 %u2013 %u2013 %u2013 %u2013 %u2013 %u2013 %u2013 Ntabankulu %u2013 3 500 %u2013 %u2013 %u2013 %u2013 1 000 %u2013 %u2013 District Municipalities %u2013 %u2013 %u2013 %u2013 %u2013 %u2013 %u2013 %u2013 %u2013 Cacadu District Municipality %u2013 %u2013 %u2013 %u2013 %u2013 %u2013 %u2013 %u2013 %u2013 Amatole District Municipality %u2013 %u2013 %u2013 %u2013 %u2013 %u2013 %u2013 %u2013 %u2013 Chris Hani District Municipality %u2013 %u2013 %u2013 %u2013 %u2013 %u2013 %u2013 %u2013 %u2013 Joe Gqabi District Municipality %u2013 %u2013 %u2013 %u2013 %u2013 %u2013 %u2013 %u2013 %u2013 O.R. Tambo District Municipality %u2013 %u2013 %u2013 %u2013 %u2013 %u2013 %u2013 %u2013 %u2013 Alfred Nzo District Municipality %u2013 %u2013 %u2013 %u2013 %u2013 %u2013 %u2013 %u2013 %u2013 Unallocated 1 000 1 000 1 000 1 000 1 000 1 000 1 000 14 966 14 966 0.0Total transfers to municipalies 1 417 757 1 350 500 1 937 855 2 130 722 1 728 452 1 728 452 1 815 756 2 051 387 2 321 561 5.12024/25 The budget increases from R1.417 billion in 2021/22 to a revised estimate of R1.728 billion in 2024/25. The budget further increases by 5.1 per cent to R1.815 billion in 2025/26. The Buffalo City and the Nelson Mandela Bay Metropolitan municipalities reflects the highest budget allocations as compared to other district and local municipalities due to funds allocated to public entities and head office. 7.5 Infrastructure payments 7.5.1 Departmental infrastructure payments Table 7: Summary of departmental payments and estimates on infrastructure Outcome Main appropriationAdjusted appropriation Revised estimate Medium-term estimates % change from 2024/25R thousand 2021/22 2022/23 2023/24 2025/26 2026/27 2027/28Existing infrastructure assets %u2013 %u2013 %u2013 %u2013 %u2013 %u2013 %u2013 %u2013 %u2013 Maintenance and repairs %u2013 %u2013 %u2013 %u2013 %u2013 %u2013 %u2013 %u2013 %u2013 Upgrades and additions %u2013 %u2013 %u2013 %u2013 %u2013 %u2013 %u2013 %u2013 %u2013 Refurbishment and rehabilitation %u2013 %u2013 %u2013 %u2013 %u2013 %u2013 %u2013 %u2013 %u2013 New infrastructure assets %u2013 %u2013 %u2013 %u2013 %u2013 %u2013 %u2013 %u2013 %u2013 Infrastructure transfers 297 484 %u2013 360 650 709 500 277 500 277 500 362 217 617 238 868 169 30.5Current %u2013 %u2013 %u2013 %u2013 %u2013 %u2013 %u2013 %u2013 %u2013 Capital 297 484 %u2013 360 650 709 500 277 500 277 500 362 217 617 238 868 169 30.5Infrastructure payments for financial assets %u2013 %u2013 %u2013 %u2013 %u2013 %u2013 %u2013 %u2013 %u2013Infrastructure leases %u2013 %u2013 %u2013 %u2013 %u2013 %u2013 %u2013 %u2013 %u2013Non infrastructure 2 605 %u2013 %u2013 %u2013 %u2013 %u2013 %u2013 %u2013 %u2013Total department infrastructure 300 089 360 650 %u2013 709 500 277 500 277 500 362 217 617 238 868 169 30.51. Total provincial infrastructure is the sum of \s non infrastructure items.2024/25626
