
Page 648 - Demo
P. 648
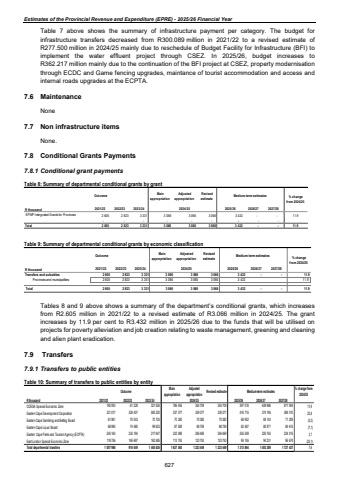
Estimates of the Provincial Revenue and Expenditure (EPRE) - 2025/26 Financial Year Table 7 above shows the summary of infrastructure payment per category. The budget for infrastructure transfers decreased from R300.089 million in 2021/22 to a revised estimate of R277.500 million in 2024/25 mainly due to reschedule of Budget Facility for Infrastructure (BFI) to implement the water effluent project through CSEZ. In 2025/26, budget increases to R362.217 million mainly due to the continuation of the BFI project at CSEZ, property modernisation through ECDC and Game fencing upgrades, maintance of tourist accommodation and access and internal roads upgrades at the ECPTA. 7.6 Maintenance None 7.7 Non infrastructure items None. 7.8 Conditional Grants Payments 7.8.1 Conditional grant payments Table 8: Summary of departmental conditional grants by grant Outcome Mainappropriation Adjusted appropriation Revised estimate 2021/22 2022/23 2023/24 2024/25 2025/26 2026/27 2027/28 2 605 2 823 3 331 3 066 3 066 3 066 3 432 - - 11.9 - - - - - - - - - Total 2 605 2 823 3 331 3 066 3 066 3 066 3 432 - - 11.9 R thousand % change from 2024/25 EPWP Intergrated Grants for Provinces Medium-term estimatesTable 9: Summary of departmental conditional grants by economic classification Outcome Mainappropriation Adjusted appropriation Revised estimate 2021/22 2022/23 2023/24 2024/25 2025/26 2026/27 2027/28Transfers and subsidies 2 605 2 823 3 331 3 066 3 066 3 066 3 432 - - 11.9 Provinces and municipalities 2 605 2 823 3 331 3 066 3 066 3 066 3 432 11.9 2 605 2 823 3 331 3 066 3 066 3 066 3 432 - - 11.9 R thousandMedium-term estimates Total % change from 2024/25 Tables 8 and 9 above shows a summary of the department%u2019s conditional grants, which increases from R2.605 million in 2021/22 to a revised estimate of R3.066 million in 2024/25. The grant increases by 11.9 per cent to R3.432 million in 2025/26 due to the funds that will be utilised on projects for poverty alleviation and job creation relating to waste management, greening and cleaning and alien plant eradication. 7.9 Transfers 7.9.1 Transfers to public entities Table 10: Summary of transfers to public entities by entity Outcome Main appropriationAdjusted appropriation Revised estimate Medium-term estimates % change from 2024/25R thousand 2021/22 2022/23 2023/24 2025/26 2026/27 2027/28COEGA Special Economic Zone 61 228 192 093 321 526 786 455 354 709 354 709 397 016 639 986 871 904 11,9Eastern Cape Development Corporation 321 017 328 407 593 220 337 377 339 377 339 377 416 715 374 195 369 010 22,8Eastern Cape Gambling and Betting Board 61 961 70 043 70 725 70 382 70 382 70 382 68 952 68 143 71 209 (2,0)Eastern Cape Liquor Board 68 995 74 480 99 623 87 509 88 759 88 759 82 467 80 971 84 615 (7,1)Eastern Cape Parks and Tourism Agency (ECPTA) 245 164 235 194 217 947 232 089 246 469 246 469 255 559 225 763 234 015 3,7East London Special Economic Zone 118 756 146 697 162 585 113 753 123 753 123 753 95 155 94 231 96 674 (23,1)Total departmental transfers 1 007 986 916 049 1 465 626 1 627 565 1 223 449 1 223 449 1 315 864 1 483 289 1 727 427 7,62024/25627
