
Page 650 - Demo
P. 650
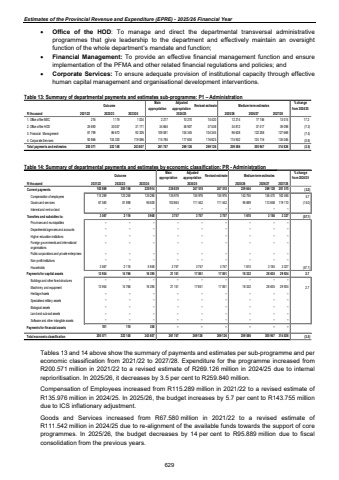
Estimates of the Provincial Revenue and Expenditure (EPRE) - 2025/26 Financial Year %uf0b7 Office of the HOD: To manage and direct the departmental transversal administrative programmes that give leadership to the department and effectively maintain an oversight function of the whole department%u2019s mandate and function; %uf0b7 Financial Management: To provide an effective financial management function and ensure implementation of the PFMA and other related financial regulations and policies; and %uf0b7 Corporate Services: To ensure adequate provision of institutional capacity through effective human capital management and organisational development interventions. Table 13: Summary of departmental payments and estimates sub-programme: P1 %u2013 Administration Outcome Main appropriationAdjusted appropriation Revised estimate Medium-term estimates % change from 2024/25R thousand 2021/22 2022/23 2023/24 2025/26 2026/27 2027/281. Office of the MEC 1 119 216 1 024 2 217 10 270 10 420 12 214 17 156 13 014 17.22. Office of the HOD 30 037 25 690 31 171 34 664 36 907 37 538 34 812 37 417 39 098 (7.3)3. Financial Management 86 672 81 799 92 326 109 081 104 345 104 345 96 628 122 258 127 668 (7.4)4. Corporate Services 104 320 92 866 119 086 115 785 117 604 116 823 115 932 124 116 135 046 (0.8)Total payments and estimates 222 148 200 571 243 607 261 747 269 126 269 126 259 586 300 947 314 826 (3.5)2024/25 Table 14: Summary of departmental payments and estimates by economic classification: PR - Administration Outcome Main appropriationAdjusted appropriation Revised estimate Medium-term estimates % change from 2024/25R thousand 2021/22 2022/23 2023/24 2025/26 2026/27 2027/28Current payments 182 869 205 156 220 914 236 839 247 518 247 518 239 644 281 575 269 128 (3.2)Compensation of employees 115 289 123 258 125 286 135 976 135 976 135 976 143 755 162 465 155 470 5.7Goods and services 67 580 81 898 95 628 100 863 111 542 111 542 95 889 119 110 113 658 (14.0)Interest and rent on land %u2013 %u2013 %u2013 %u2013 %u2013 %u2013 %u2013 %u2013 %u2013Transfers and subsidies to: 3 567 2 116 5 948 3 757 3 757 3 757 1 610 3 327 3 184 (57.1)Provinces and municipalities %u2013 %u2013 %u2013 %u2013 %u2013 %u2013 %u2013 %u2013 %u2013Departmental agencies and accounts %u2013 %u2013 %u2013 %u2013 %u2013 %u2013 %u2013 %u2013 %u2013Higher education institutions %u2013 %u2013 %u2013 %u2013 %u2013 %u2013 %u2013 %u2013 %u2013Foreign governments and international organisations %u2013 %u2013 %u2013 %u2013 %u2013 %u2013 %u2013 %u2013 %u2013Public corporations and private enterprises %u2013 %u2013 %u2013 %u2013 %u2013 %u2013 %u2013 %u2013 %u2013Non-profit institutions %u2013 %u2013 %u2013 %u2013 %u2013 %u2013 %u2013 %u2013 %u2013Households 3 567 2 116 5 948 3 757 3 757 3 757 1 610 3 327 3 184 (57.1)Payments for capital assets 13 954 14 766 16 395 21 151 17 851 17 851 18 332 29 924 28 635 2.7Buildings and other fixed structures %u2013 %u2013 %u2013 %u2013 %u2013 %u2013 %u2013 %u2013 %u2013Machinery and equipment 13 954 14 766 16 395 21 151 17 851 17 851 18 332 29 924 28 635 2.7Heritage Assets %u2013 %u2013 %u2013 %u2013 %u2013 %u2013 %u2013 %u2013 %u2013Specialised military assets %u2013 %u2013 %u2013 %u2013 %u2013 %u2013 %u2013 %u2013 %u2013Biological assets %u2013 %u2013 %u2013 %u2013 %u2013 %u2013 %u2013 %u2013 %u2013Land and sub-soil assets %u2013 %u2013 %u2013 %u2013 %u2013 %u2013 %u2013 %u2013 %u2013Software and other intangible assets %u2013 %u2013 %u2013 %u2013 %u2013 %u2013 %u2013 %u2013 %u2013Payments for financial assets 181 110 350 %u2013 %u2013 %u2013 %u2013 %u2013 %u2013Total economic classification 200 571 222 148 243 607 261 747 269 126 269 126 259 586 314 826 300 947 (3.5)2024/25Tables 13 and 14 above show the summary of payments and estimates per sub-programme and per economic classification from 2021/22 to 2027/28. Expenditure for the programme increased from R200.571 million in 2021/22 to a revised estimate of R269.126 million in 2024/25 due to internal reprioritisation. In 2025/26, it decreases by 3.5 per cent to R259.840 million. Compensation of Employees increased from R115.289 million in 2021/22 to a revised estimate of R135.976 million in 2024/25. In 2025/26, the budget increases by 5.7 per cent to R143.755 million due to ICS inflationary adjustment. Goods and Services increased from R67.580 million in 2021/22 to a revised estimate of R111.542 million in 2024/25 due to re-alignment of the available funds towards the support of core programmes. In 2025/26, the budget decreases by 14 per cent to R95.889 million due to fiscal consolidation from the previous years. 629
