Page 654 - Demo
P. 654
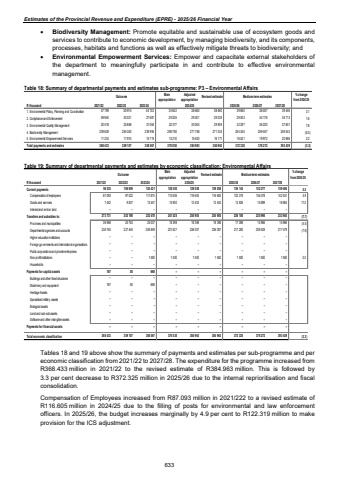
Estimates of the Provincial Revenue and Expenditure (EPRE) - 2025/26 Financial Year %uf0b7 Biodiversity Management: Promote equitable and sustainable use of ecosystem goods and services to contribute to economic development, by managing biodiversity, and its components, processes, habitats and functions as well as effectively mitigate threats to biodiversity; and %uf0b7 Environmental Empowerment Services: Empower and capacitate external stakeholders of the department to meaningfully participate in and contribute to effective environmental management. Table 18: Summary of departmental payments and estimates sub-programme: P3 %u2013 Environmental Affairs Outcome Main appropriationAdjusted appropriation Revised estimate Medium-term estimates % change from 2024/25R thousand 2021/22 2022/23 2023/24 2025/26 2026/27 2027/281. Environmental Policy, Planning and Coordination 35 914 47 199 44 102 35 632 38 460 38 460 39 660 38 457 39 446 3.12. Compliance and Enforcement 30 021 49 944 27 687 29 028 29 301 29 039 29 503 34 176 35 713 1.63. Environmental Quality Management 25 848 20 418 31 064 32 377 30 044 29 959 32 297 36 220 37 851 7.84. Biodiversity Management 255 350 239 639 239 995 259 783 271 758 271 334 254 344 249 447 259 543 (6.3)5. Environmental Empowerment Services 11 974 11 233 15 719 13 210 15 400 16 171 16 521 19 972 20 886 2.2Total payments and estimates 359 107 368 433 358 567 370 030 384 963 384 963 372 325 378 272 393 439 (3.3)2024/25 Table 19: Summary of departmental payments and estimates by economic classification: Environmental AffairsOutcome Main appropriationAdjusted appropriation Revised estimate Medium-term estimates % change from 2024/25R thousand 2021/22 2022/23 2023/24 2025/26 2026/27 2027/28Current payments 106 859 94 535 125 421 128 505 129 058 129 058 136 145 152 277 159 494 5.5Compensation of employees 97 022 87 093 111 874 113 605 116 605 116 605 122 319 136 378 142 531 4.9Goods and services 9 837 7 442 13 547 14 900 12 453 12 453 13 826 15 899 16 963 11.0Interest and rent on land %u2013 %u2013 %u2013 %u2013 %u2013 %u2013 %u2013 %u2013 %u2013 Transfers and subsidies to: 252 198 273 731 232 478 241 525 255 905 255 905 236 180 225 995 233 945 (7.7)Provinces and municipalities 24 753 36 968 24 037 18 398 18 398 18 398 17 398 14 966 14 966 (5.4)Departmental agencies and accounts 236 763 227 445 206 849 221 627 236 007 236 007 217 282 209 529 217 479 (7.9)Higher education institutions %u2013 %u2013 %u2013 %u2013 %u2013 %u2013 %u2013 %u2013 %u2013Foreign governments and international organisations %u2013 %u2013 %u2013 %u2013 %u2013 %u2013 %u2013 %u2013 %u2013Public corporations and private enterprises %u2013 %u2013 %u2013 %u2013 %u2013 %u2013 %u2013 %u2013 %u2013Non-profit institutions %u2013 %u2013 1 592 1 500 1 500 1 500 1 500 1 500 1 500 0.0Households %u2013 %u2013 %u2013 %u2013 %u2013 %u2013 %u2013 %u2013 %u2013Payments for capital assets 167 50 668 %u2013 %u2013 %u2013 %u2013 %u2013 %u2013Buildings and other fixed structures %u2013 %u2013 %u2013 %u2013 %u2013 %u2013 %u2013 %u2013 %u2013Machinery and equipment 167 50 668 %u2013 %u2013 %u2013 %u2013 %u2013 %u2013Heritage Assets %u2013 %u2013 %u2013 %u2013 %u2013 %u2013 %u2013 %u2013 %u2013Specialised military assets %u2013 %u2013 %u2013 %u2013 %u2013 %u2013 %u2013 %u2013 %u2013Biological assets %u2013 %u2013 %u2013 %u2013 %u2013 %u2013 %u2013 %u2013 %u2013Land and sub-soil assets %u2013 %u2013 %u2013 %u2013 %u2013 %u2013 %u2013 %u2013 %u2013Software and other intangible assets %u2013 %u2013 %u2013 %u2013 %u2013 %u2013 %u2013 %u2013 %u2013Payments for financial assets %u2013 %u2013 %u2013 %u2013 %u2013 %u2013 %u2013 %u2013 %u2013Total economic classification 368 433 359 107 358 567 370 030 384 963 384 963 372 325 378 272 393 439 (3.3)2024/25Tables 18 and 19 above show the summary of payments and estimates per sub-programme and per economic classification from 2021/22 to 2027/28. The expenditure for the programme increased from R368.433 million in 2021/22 to the revised estimate of R384.963 million. This is followed by 3.3 per cent decrease to R372.325 million in 2025/26 due to the internal reprioritisation and fiscal consolidation. Compensation of Employees increased from R87.093 million in 2021/222 to a revised estimate of R116.605 million in 2024/25 due to the filling of posts for environmental and law enforcement officers. In 2025/26, the budget increases marginally by 4.9 per cent to R122.319 million to make provision for the ICS adjustment. 633


