
Page 656 - Demo
P. 656
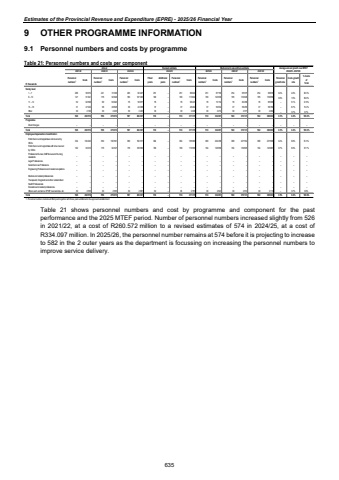
Estimates of the Provincial Revenue and Expenditure (EPRE) - 2025/26 Financial Year 9 OTHER PROGRAMME INFORMATION 9.1 Personnel numbers and costs by programme Table 21: Personnel numbers and costs per component Actual Revised estimate Medium-term expenditure estimateR thousandsPersonnel numbers1 Costs Personnel numbers1 Costs Personnel numbers1 Costs Filled postsAdditional postsPersonnel numbers1 Costs Personnel numbers1 Costs Personnel numbers1 Costs Personnel numbers1 Costs Personnel growth rate Costs growth rate % Costs of Total Salary level1 %u2013 7 266 56 972 241 72 336 245 82 407 251 %u2013 251 86 624 251 87 799 254 95 575 254 99 876 0.4% 4.9% 26.3%8 %u2013 10 147 91 641 178 92 648 180 107 293 180 %u2013 180 113 844 180 120 938 185 133 628 185 139 656 0.9% 7.0% 36.0%11 %u2013 12 52 62 596 69 63 640 76 59 677 76 %u2013 76 66 223 76 72 154 76 82 296 76 85 998 %u2013 9.1% 21.8%13 %u2013 16 31 47 202 38 48 826 36 43 038 37 %u2013 37 48 462 37 50 934 37 56 255 37 58 789 %u2013 6.7% 15.2%Other 30 2 160 30 2 223 30 2 223 30 %u2013 30 2 226 30 2 272 30 2 377 30 2 484 %u2013 3.7% 0.7%Total 526 260 572 556 279 673 567 294 637 574 %u2013 574 317 379 574 334 097 582 370 131 582 386 803 0.5% 6.8% 100.0%ProgrammeDir ect char ges %u2013 %u2013 %u2013 %u2013 %u2013 %u2013 %u2013 %u2013 %u2013 %u2013 %u2013 %u2013 %u2013 %u2013 %u2013 %u2013 %u2013 %u2013 %u2013Total 526 260 572 556 279 673 567 294 637 574 %u2013 574 317 379 574 334 097 582 370 131 582 386 803 0.5% 6.8% 100.0%Employee dispensation classificationPublic Service Act appointees not covered by OSDs 334 164 943 350 182 591 359 182 017 364 %u2013 364 195 083 360 204 296 368 227 552 368 237 806 0.4% 6.8% 61.5%Public Service Act appointees still to be covered by OSDs 162 93 074 176 94 527 178 109 953 180 %u2013 180 119 509 184 126 958 184 139 605 184 145 887 0.7% 6.9% 37.7%Professional Nurses, Staff Nurses and Nursing Assistants %u2013 %u2013 %u2013 %u2013 %u2013 %u2013 %u2013 %u2013 %u2013 %u2013 %u2013 %u2013 %u2013 %u2013 %u2013 %u2013 %u2013 %u2013 %u2013Legal Professionals %u2013 %u2013 %u2013 %u2013 %u2013 %u2013 %u2013 %u2013 %u2013 %u2013 %u2013 %u2013 %u2013 %u2013 %u2013 %u2013 %u2013 %u2013 %u2013Social Ser v ices Pr ofessions %u2013 %u2013 %u2013 %u2013 %u2013 %u2013 %u2013 %u2013 %u2013 %u2013 %u2013 %u2013 %u2013 %u2013 %u2013 %u2013 %u2013 %u2013 %u2013Engineering Professions and related occupations %u2013 %u2013 %u2013 %u2013 %u2013 %u2013 %u2013 %u2013 %u2013 %u2013 %u2013 %u2013 %u2013 %u2013 %u2013 %u2013 %u2013 %u2013 %u2013Medical and related professionals %u2013 %u2013 %u2013 %u2013 %u2013 %u2013 %u2013 %u2013 %u2013 %u2013 %u2013 %u2013 %u2013 %u2013 %u2013 %u2013 %u2013 %u2013 %u2013Therapeutic, Diagnostic and other related Allied Health Professionals %u2013 %u2013 %u2013 %u2013 %u2013 %u2013 %u2013 %u2013 %u2013 %u2013 %u2013 %u2013 %u2013 %u2013 %u2013 %u2013 %u2013 %u2013 %u2013Educators and related professionals %u2013 %u2013 %u2013 %u2013 %u2013 %u2013 %u2013 %u2013 %u2013 %u2013 %u2013 %u2013 %u2013 %u2013 %u2013 %u2013 %u2013 %u2013 %u2013Others such as interns, EPWP, learnerships, etc 30 2 555 30 2 555 30 2 667 30 %u2013 30 2 787 30 2 843 30 2 974 30 3 110 %u2013 3.7% 0.8%Total 526 260 572 556 279 673 567 294 637 574 %u2013 574 317 379 574 334 097 582 370 131 582 386 803 0.5% 6.8% 100.0%1. Personnel numbers includes all filled posts together with those posts additional to the approved establishment Average annual growth over MTEF 2021/22 2022/23 2023/24 2024/25 2025/26 2026/27 2027/28 2024/25 - 2027/28Table 21 shows personnel numbers and cost by programme and component for the past performance and the 2025 MTEF period. Number of personnel numbers increased slightly from 526 in 2021/22, at a cost of R260.572 million to a revised estimates of 574 in 2024/25, at a cost of R334.097 million. In 2025/26, the personnel number remains at 574 before it is projecting to increase to 582 in the 2 outer years as the department is focussing on increasing the personnel numbers to improve service delivery. 635
